How to Do a Competitive Analysis | Case Study Included
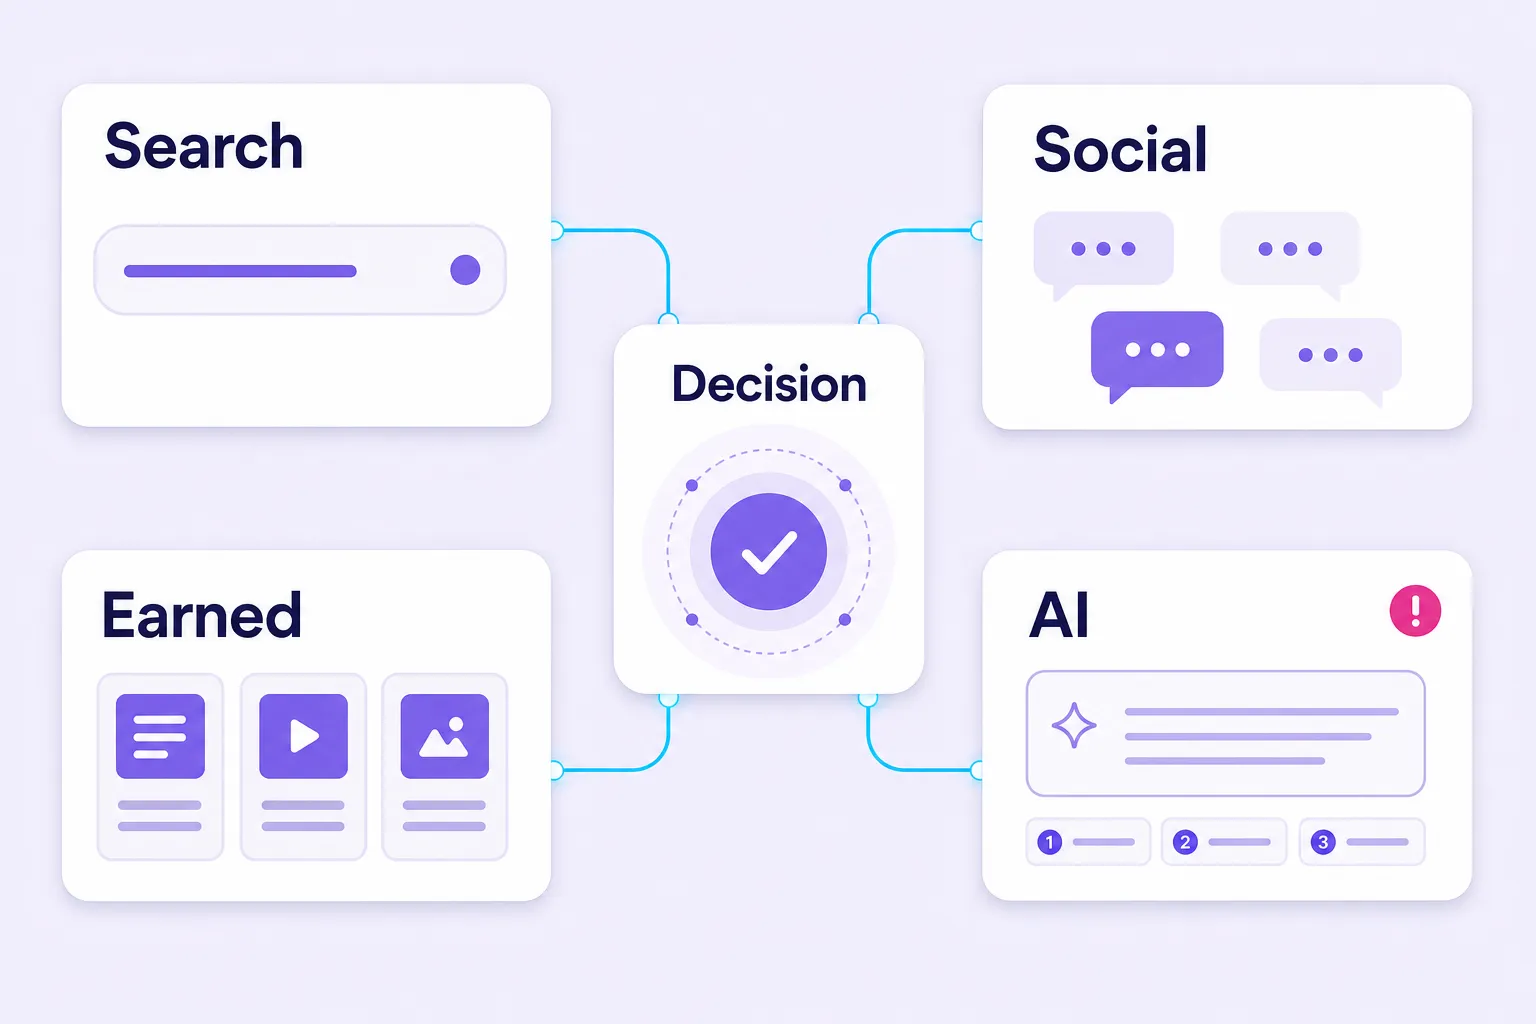
Quick Answer: A competitive analysis in 2026 is a repeatable process of comparing your brand with real rivals across four surfaces - classic search, social and community, earned media, and AI answe…

Quick Answer: A competitive analysis in 2026 is a repeatable process of comparing your brand with real rivals across four surfaces - classic search, social and community, earned media, and AI answer engines - and converting each signal into a specific decision. Build your true competitor set, score rivals across six weighted dimensions, run it on a loop, and act on the direction of travel between runs, not a one-time snapshot.
Summary
- A competitive analysis in 2026 spans four surfaces, not one: classic search, social and community, earned media, and AI answer engines. A rival you ignore on one surface is usually winning on another.
- U.S. prestige beauty sales grew 7% to $17.1 billion in H1 2026 and mass beauty grew 7% to $39.2 billion, per Circana. Category growth hides concentration, so always segment by brand tier.
- TikTok overtook Instagram as the number one beauty platform by Earned Media Value in 2025, generating $18.1 billion at 55.6% year-over-year growth, according to WeArisma. Last year's channel map is already wrong.
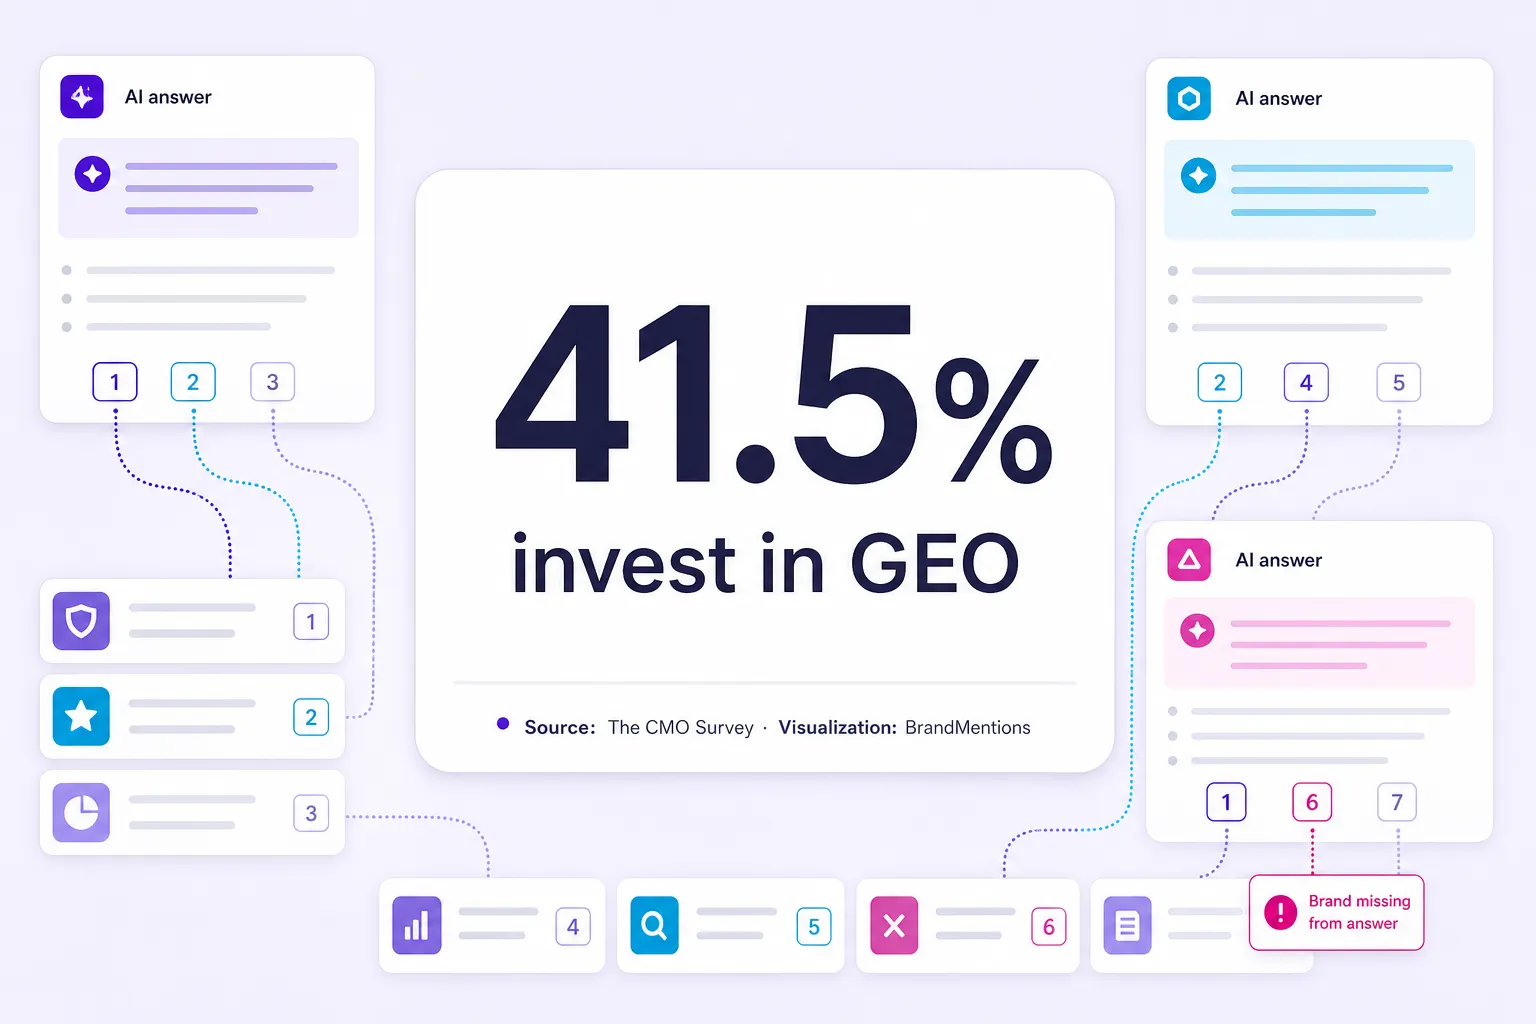
- 41.5% of marketing organizations now invest in Generative Engine Optimization, per The CMO Survey, because buyers increasingly read a recommendation inside an AI answer before they ever reach a search result.
- Google states that AI Overviews and AI Mode need no special schema or separate optimization beyond Search fundamentals, so AI visibility analysis measures answer quality and evidence consistency, not a new technical trick.
- 97% of consumers read reviews, per BrightLocal's 2026 survey of 1,002 U.S. adults, and the FTC's Consumer Reviews and Testimonials Rule has been enforceable since October 21, 2024. Reputation is now a compliance surface, not just a soft metric.
Most competitive analyses die the same quiet death. Someone builds a 40-slide deck, presents it once, and nobody opens it again. The research was real. The decision it was supposed to change never happened.
I have run enough of these inside content and monitoring programs to tell you the skill is not collecting data on your rivals. It is catching the few signals that should move a decision and ignoring the rest. This guide walks that job end to end, with a full beauty-category case study grounded in public data, and it adds the surface most older guides still miss completely: what AI engines say about you and your competitors the moment a buyer asks.
At a Glance: Which Approach Fits Your Scenario
- Best for zero budget: Manual SERP and AI audit. Search your top 10 category queries across Google, TikTok, and one AI engine, record who appears and in what format, and you have a free competitor set in an afternoon.
- Best for fast ROI: Share-of-voice tracking. You see who owns the conversation within days, and it tells you directly where attention already exists.
- Best for reputation defense: Sentiment and review analysis. The fastest way to catch a complaint about to spread, or a rival weakness you can exploit in messaging.
- Best for channel strategy: Social and creator teardown. Shows which platforms and formats rivals actually win on, not where they post most.
- Best for revenue defense: Offer, pricing, and distribution analysis. Explains why customers switch when the product looks similar on paper.
- Best for future-proofing: AI answer-engine visibility. The only surface that tells you whether ChatGPT or Perplexity recommends you or a competitor before a click ever happens.
- Best for lean teams: Own one surface deeply. A shallow four-surface sweep produces vague insights nobody acts on. One surface, one monthly cadence, beats a quarterly attempt at everything.
What Is a Competitive Analysis?
A competitive analysis is the structured process of comparing your brand with current and potential rivals across demand, offer, visibility, reputation, distribution, and AI-answer presence. This allows you to decide where to defend, where to copy carefully, where to ignore noise, and where to attack. It is not a one-time SWOT grid. It is a repeatable read on where you win, where they win, and what you do about it next quarter.
That definition matters because competitors no longer sit neatly inside your product category. A skincare brand competes with other skincare brands, yes. It also competes with dermatologists on YouTube, Reddit threads ranking ingredients, TikTok creators demonstrating "dupes," retailer private labels, loyalty programs that make switching feel expensive, and the AI answer that names three brands and quietly omits a fourth.
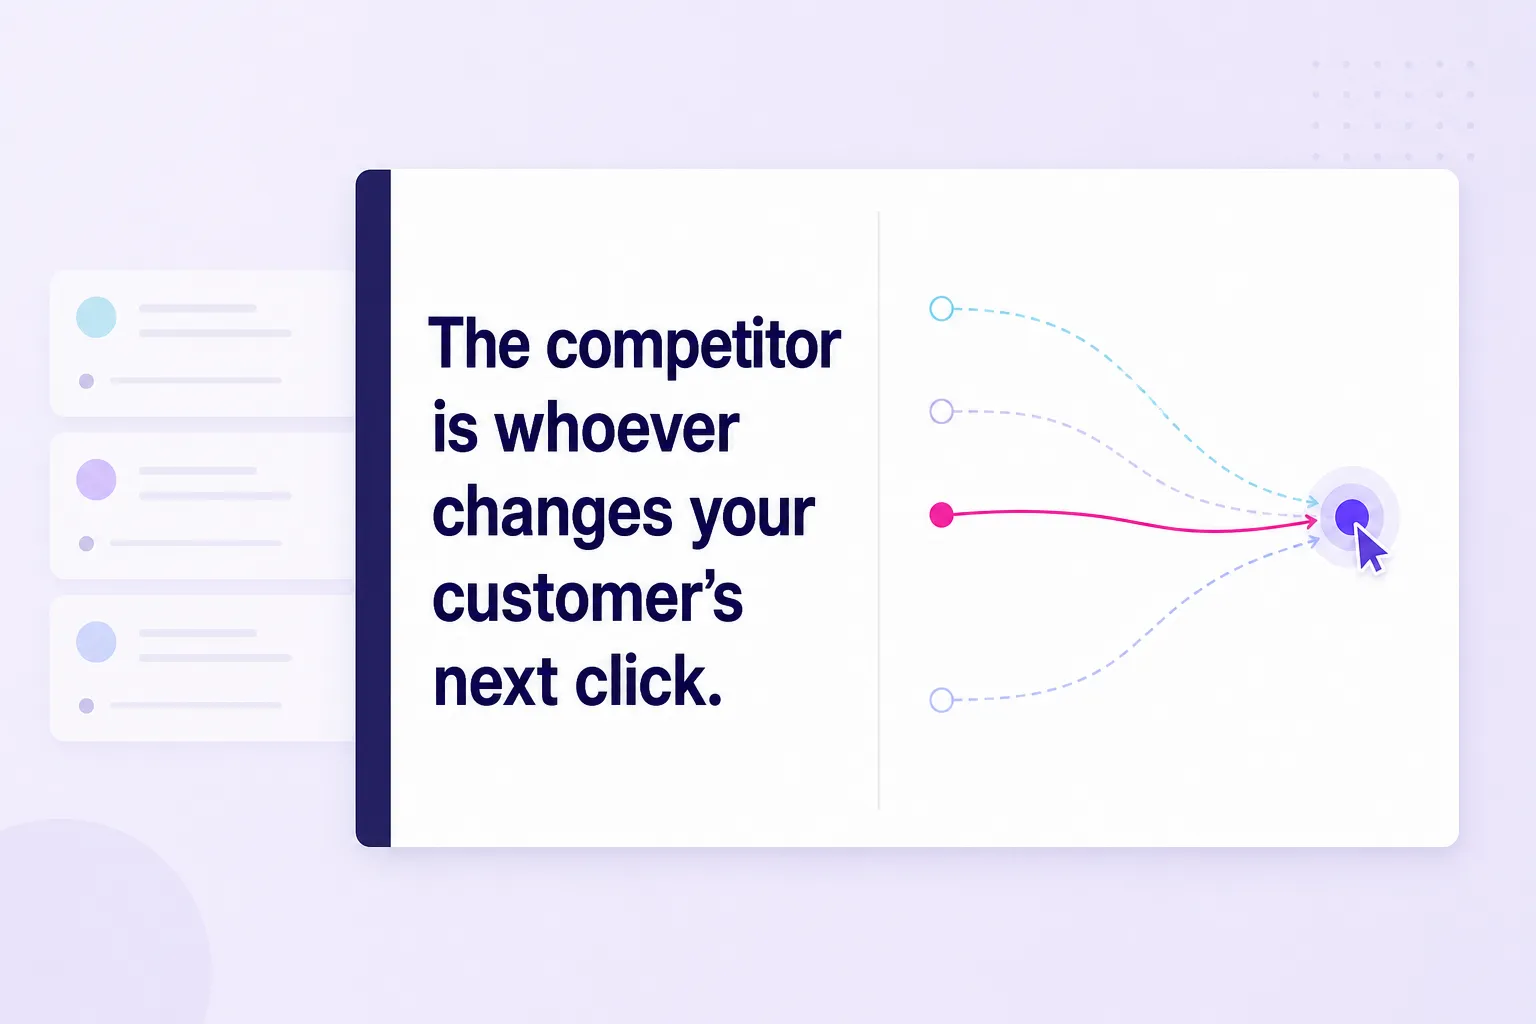
The competitor is whoever changes your customer's next click.
That rival may not sell what you sell. It may simply own the answer, the shelf, the review, or the creator at the moment your customer decides.
How Is Competitive Analysis Different in the AI Search Era?
This is the question that separates a 2026 analysis from a recycled one. A third conversation now shapes demand, and most teams are not measuring it.
Here is what to understand first. Google's own AI features documentation states that the same Search fundamentals apply to AI Overviews and AI Mode, and that site owners do not need special additional optimization to appear in those experiences. So the work is not a schema hack. It is comparing the evidence competitors publish, not just the page positions they hold.
The practical shift is that influence can now happen before the click. A competitor can lose traffic and still gain consideration if AI answers summarize or cite its content. Classic analytics will never show you that conversation, because it happens inside a generated answer with no visit attached.
The Three-Conversation Rule: audit social, classic search, and AI answers as three separate competitive surfaces. Win two and lose the third, and you lose the shortlist without ever seeing it on a dashboard.
One warning on the AI data flying around. Reported figures for "ChatGPT's share of AI referral traffic" conflict wildly because they use different denominators (website visits, referral clicks, answer citations). Do not treat them as interchangeable. The reliable takeaway is simpler: ChatGPT leads generative AI traffic but its share is declining as Gemini and Perplexity grow, so audit at least three engines or you are measuring a shrinking slice.
How Does a Competitive Analysis Differ from a SWOT?
A SWOT is a summary. A competitive analysis is the evidence behind the summary.
SWOT sorts observations into four boxes. That helps executives align, but it rarely tells a marketer what to do on Monday morning. A real competitive analysis goes deeper: which rival owns a specific search intent, which brand carries a repeated customer complaint, which offer removes friction, which ad angle keeps running, which creator drives trust.
Use SWOT at the end, not the beginning. If your SWOT does not carry source data, dates, and a decision attached to each point, it is a brainstorming note, not intelligence.
If you cannot name the decision a piece of competitor data will change, you are not doing analysis. You are building a scrapbook.
Can You Run a Competitive Analysis With Zero Budget?
Yes, for the first pass. You hit the ceiling faster than people admit.
A free stack produces real intelligence: Google in incognito for SERP position and content format, Google Trends for relative interest, the Meta Ad Library for every active ad a competitor runs (with start dates and offers), TikTok Creative Center for trending formats, and manual queries in ChatGPT, Perplexity, and Google AI Overviews using the same 20 category questions each month. That costs only time, and it is a legitimate Step 1.
What free tools cannot do is the expensive part: persistent mention tracking across web, social, forums, and news at once, sentiment at scale, historical trend lines, audience overlap, and automated AI-visibility logging with citation sources.
My rule of thumb: run the manual pass to confirm the question is worth answering. If the finding would change a real budget or roadmap decision, graduate to a tool that fills your single most expensive gap. Do not buy a suite to solve a problem you have not confirmed you have.
Free gets you the map. Paid gets you the movement. Never skip the manual pass just because you own a tool, and never buy the tool to confirm a hunch you have not pressure-tested by hand.
Why Perform a Competitive Analysis Now?
Because the cost of not knowing went up. Markets got more crowded and buyers got faster to leave.
The competitive intelligence services market is expanding at a double-digit annual rate through 2031, which tells you how much this function is being resourced across the industry. The data that sits inside your own CRM is also frequently wrong about who you are fighting. Win-loss interviews routinely show buyers naming a different main alternative than the one recorded by sales. That single gap is why an external analysis usually beats internal assumptions.
A clean competitive analysis lets you sharpen positioning, find underserved segments, prioritize the roadmap, and fix the exact weaknesses customers already complain about. Run it as a loop, not an event.
The 90-Day Signal Test: collect a competitive data point only if it can change a specific decision within the next 90 days. Apply it ruthlessly. If knowing a number would not move a budget, a campaign, a content priority, or a product choice, you do not need the number.
How to Do a Competitive Analysis: The Four Surfaces, Scored
To keep this concrete, I ran the full workflow against the cosmetics category, the same niche the original version of this guide used, so you can see each surface on real published data rather than theory. Here is how the six core tactics compare on what they actually cost to execute - and the tools that get each one done.
| Tactic | Surface | Execution complexity | Time to first insight | Example tools | Best signal it produces |
|---|---|---|---|---|---|
| Build the real competitor set | All | Low | Hours | Google (incognito), ChatGPT, Perplexity, Google AI Overviews, TikTok and Instagram search | The true rivals, not the CRM ones |
| Popularity and share of voice | Search + social | Medium | 2 to 5 days | Google Search Console, Google Trends, BrandMentions | Who owns the conversation |
| Public perception and sentiment | Earned | Medium | 1 week | BrandMentions, Brandwatch, Talkwalker, Sprout Social | Reputation risk and rival weak points |
| Social and creator teardown | Social | Medium to high | 1 to 2 weeks | TikTok Creative Center, Meta Ad Library, social media analytics tools | Winning channels and formats |
| Offer, pricing, distribution | Offer | Medium | 1 week | Meta Ad Library, SEC filings (10-K), competitor sites | Why customers actually switch |
| AI answer-engine visibility | AI | High | 2 to 4 weeks | ChatGPT, Perplexity, Google AI Overviews, BrandMentions | Whether AI recommends you or them |
Step 1. Build Your Real Competitor Set
Start with the fact that teams already do this work: HubSpot’s 2026 State of Marketing report found that 57% of marketers conduct competitor analyses when defining their brand, while The CMO Survey found that 58.9% collect competitor data when demonstrating marketing’s value.”
Build the set from four inputs, not one:
- Search: Pull the domains that recur across your top 10 to 15 high-intent searches.
- AI answers: Record every brand named when you ask ChatGPT, Perplexity, and Google AI Overviews for category recommendations.
- Social: Note which brands dominate TikTok and Instagram search for your core terms.
- Internal: Ask your sales team which three rivals prospects mention most, and survey churned customers on where they went.
Cross-reference. The brands in every list are your core set. The ones that appear only in AI answers are your early-warning signals.
The cosmetics category makes the point. The set is no longer only the legacy houses. It is founder-led brands like Rhode, ingredient-led independents, and K-beauty entrants moving at speed. When you map the players crowding your category feeds, keep your social media competitors as a distinct list from your search competitors, because they overlap but rarely perfectly.
Non-obvious insight: a competitor with a weaker product can be more dangerous if it owns a stronger buying context. A retailer shelf, a creator routine, a dupe conversation, or a loyalty program can beat a better formula.
The competitor you have never heard of but who keeps surfacing in AI recommendations is more dangerous than the one you have watched for three years.
Step 2. Analyze Popularity and Share of Voice
Once you have the set, the question is who owns the conversation. Start with your own first-party demand in Google Search Console, whose branded-query filter now provides 16 months of history starting from March 2025. Google also warns that those branded classifications are informational and can be wrong, and that it stores only the most important query rows, so export data and triangulate rather than trusting a single view.
Then compare rivals on volume across web and social. Manually tracking every mention is not realistic, which is where a monitoring layer earns its place. The honest definition of popularity here is most mentioned, weighted by who is doing the mentioning. A thousand mentions from nobody beats far fewer from the right voices, and knowing which is which is the whole game.
One hard constraint most guides skip: you cannot compare raw share of voice across platforms without normalizing it. Each surface has different API access, visibility rules, private accounts, deleted posts, bot activity, and sampling limits. Twitter-era volume is not comparable to a walled feed. Treat share of voice as directional within a platform, then compare the direction of travel across platforms, never the absolute counts.
Use a consistent set of marketing KPIs so you measure the same thing every quarter instead of inventing new metrics each run. And resist vanity: a spike driven by one viral complaint is not popularity. It is a Step 3 problem wearing a Step 2 costume.
Step 3. Identify the Public Perception of Competitors
Volume tells you who is talked about. Sentiment tells you whether that is good news. According to BrightLocal's 2026 Local Consumer Review Survey of 1,002 U.S. adults, 97% of consumers read reviews and the average shopper consults six review sites before choosing. The old line that all publicity is good publicity does not survive contact with that data.
Run sentiment across the full mention set, then split it by brand and by source. In cosmetics the pattern repeats: a brand can lead in positive social mentions while carrying the highest negative volume, because the brands people love loudest are the ones they complain about loudest. Polarization is a signal, not a contradiction.
Two things to watch. People are far more motivated to post a bad experience than a good one, so raw sentiment skews harsh across every brand, which means you compare rivals against each other, never against an absolute. And a high neutral score usually hides the most interesting story: it means a brand is discussed functionally (price, dupes, where to buy) rather than emotionally, which is a different competitive position entirely.
Be honest about machine limits here. Modern transformer-based sentiment reaches roughly 75% to 85% accuracy on clear mentions but drops to around 60% to 70% on sarcasm and mixed content. Automate the detection. Keep the decision human. For monitoring the mentions and sentiment shifts that drive this surface, BrandMentions fits a specific niche: continuous web and social mention tracking with sentiment filtering by source, language, and influencer reach, so a negative post from a 50,000-follower account is not weighted the same as an obscure blog comment. Brandwatch suits enterprise listening programs, Talkwalker suits larger consumer-intelligence teams, and Sprout Social suits owned-channel reporting.
There is a compliance line you must respect. The FTC's Consumer Reviews and Testimonials Rule has been enforceable since October 21, 2024, and it bars creating, buying, or selling fake reviews and incentivizing a specific sentiment. If your competitive read finds a rival with a suspicious review burst, that is intelligence, not a tactic to copy.
Both positive and negative mentions move the purchase decision. The job is not to eliminate the negative. It is to catch the few negatives about to spread, and to learn from rivals who handled theirs badly.
Step 4. Analyze the Social and Creator Strategy
Do not ask which competitor posts most. Ask which competitor gets carried by the market. Platform mechanics make the distinction concrete: TikTok's recommendation documentation states that follower count and previous high-performing videos are not direct recommendation factors, so a large account does not automatically win the For You feed. YouTube's recommendation system weights clicks, views, watchtime, surveys, shares, likes, and dislikes, but its quality systems can override raw engagement.
So separate surface metrics from signal metrics. Follower count, total posts, and likes are surface. Engagement rate per format, save and share rates, comment sentiment, and audience overlap are signal. A competitor with huge followers but low saves has passive attention. A smaller rival with strong save and share rates has an invested audience, and that is the more dangerous one.
Spend 30 to 45 minutes per rival auditing their last 30 to 60 posts per platform, logging format, engagement rate, saves, shares, and comment themes. Benchmark like-for-like with proper social media analytics tools rather than screenshots, and separate what rivals earned from what they paid for using an earned vs paid media lens. A channel that looks dominant on paid spend is a different threat than one winning organically.
The influencer layer changed the math. Per WeArisma's 2026 Beauty Influence Index, TikTok generated $18.1 billion in beauty Earned Media Value in 2025, up 55.6%, overtaking Instagram, which declined 8.2%. If your social strategy still allocates most of its budget to Instagram and treats TikTok as secondary, you are investing against the trend.
Non-obvious insight: the safest competitor signal is not "who did they pay?" It is "which creator phrase moved into customer language?" When shoppers repeat a creator's exact wording in reviews, comments, and search, the campaign has rewritten category vocabulary, and that is a positioning event you can respond to.
Step 5. Compare Offer, Pricing, and Distribution
Never analyze visibility without offer mechanics. Sometimes the rival is not winning on messaging. They are winning because their offer is easier to say yes to. Distribution data is public enough to read precisely. Ulta Beauty's fiscal 2025 Form 10-K shows 1,591 stores worldwide as of January 31, 2026, and reports that omnichannel guests historically spend over three times as much as store-only guests. Ulta also reported Q2 fiscal 2026 net sales of $3.0 billion, up 8.9%, with comparable sales growth of 3.8%.
Now compare Sephora. LVMH does not break out Sephora separately, but its H1 2026 results reported Selective Retailing revenue of €8.406 billion, organic growth of 5% in the half and 6% in Q2, plus exclusive launches such as Rhode in North America and the U.K. The competitive read is not "who is bigger." It is this: Ulta's edge is measurable U.S. scale, loyalty data, and store-to-digital access, while Sephora's edge is prestige discovery, exclusive brand heat, and global reach.
A challenger should not try to beat both. Pick the wedge. Beat Ulta on specialization and community. Beat Sephora on accessibility and price-to-performance. The strategy becomes obvious only once offer and distribution sit next to visibility.
Non-obvious insight: pricing analysis without distribution analysis misses the real switching cost. Customers do not only switch on price. They switch because one option is easier to discover, test, return, replenish, finance, or trust. To understand whether a rival's reach is translating into real recall, pair this step with how you measure brand awareness, because a demand spike without a conversion lift usually means people know the name but still need proof.
Step 6. Audit AI Answer-Engine Visibility
This is the surface that did not exist when the original guide was written, and it is now the one most likely to blindside you. The adoption is real: 41.5% of organizations now invest in Generative Engine Optimization, and the number has climbed every survey cycle. When a buyer asks an assistant to recommend a brand, you either appear or you do not, and no social listening tool flags your absence.
AI engines do not rank brands. They describe them. "Budget-friendly but limited." "Clinical formulations with a steeper learning curve." "Ultra-luxury with results some dermatologists question." That framing is your competitive position in AI, and it is shaped by sources you may not control. Semrush's 2026 AI Visibility Index, built on 126 million U.S. AI search prompts across 22 industries, found that visibility in AI answers often has near-zero correlation with classic search rankings. A brand can own page one of Google and be invisible in ChatGPT, and the reverse is just as true.
Run the audit across at least three engines, because each weights source types differently. Track four metrics per engine:
- Mention rate - below 10% of a prompt set means effectively invisible.
- Recommendation rate - how often the engine actively suggests the brand.
- Average position in the answer.
- Citation sources - the exact third-party URLs cited to support each recommendation, which matter most.
The Citation Source Diagnostic: for every AI answer that recommends a rival, record both the recommendation and the evidence URLs behind it. When a competitor's top Perplexity position traces back to two Reddit threads, a review-platform page, and an editorial listicle, you have found the three pages doing the competitive work. Your job is earning citations on those source types, not publishing another post on your own domain.
AI visibility is a consistency report, not a ranking report. If your site says one thing, reviews say another, and third-party mentions say a third, the engine synthesizes the conflict and your perception fragments. Fix the evidence spread across your site, reviews, retailer pages, and social profiles, and the AI framing follows.
BrandMentions fits here as a continuous layer for monitoring the web, news, and social mentions that AI answers draw from, which is exactly the input you need to feed this diagnostic. Treat it as complementary to classic listening, not a replacement for it.
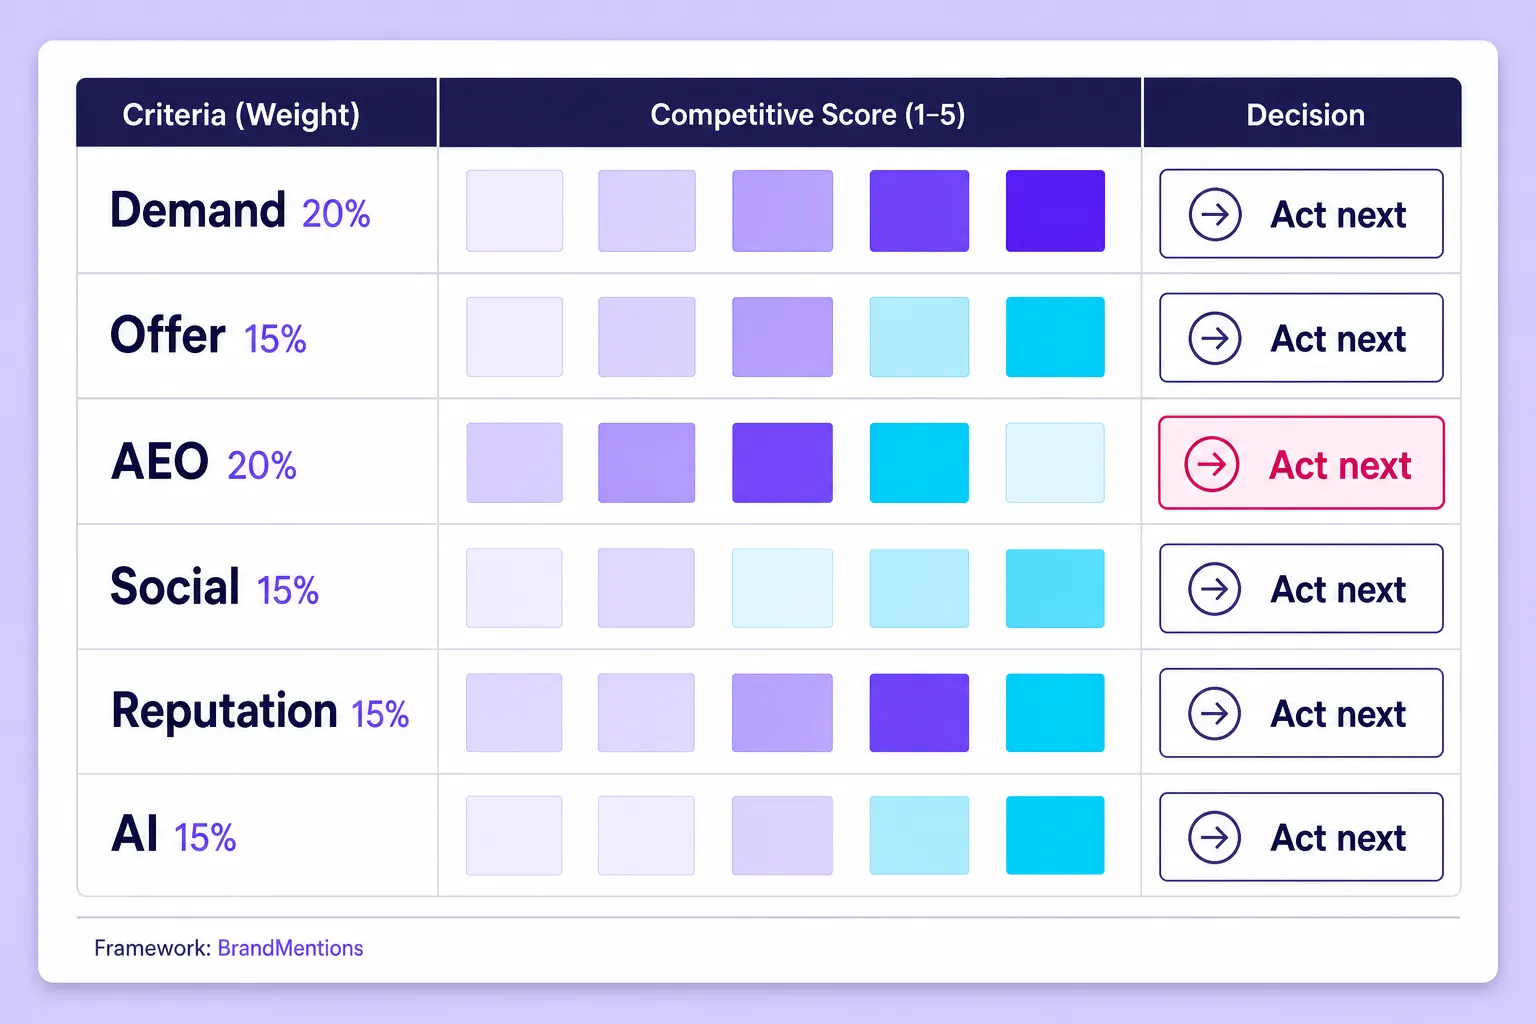
The Competitor Signal Scorecard
Here is the asset I wish every team used instead of a deck. It turns six scattered surfaces into one comparable number per competitor, weighted for what drives decisions now. Score each rival 1 to 5 per dimension, multiply by the weight, and sum.
| Dimension | What you measure | Weight | How to score 5 |
|---|---|---|---|
| Demand and share of voice | Branded and category search, web and social mentions | 20% | Clear category leader in attention |
| Offer and distribution | Price, bundle, trial, loyalty, retail access, returns | 15% | Lowest friction to say yes |
| Organic and AEO visibility | Search coverage, AI-answer inclusion, answer clarity, evidence depth | 20% | Owns the research moment across surfaces |
| Social and creator pull | Save and share rate, creator reuse, platform fit | 15% | Market carries their content |
| Reputation and sentiment | Rating trend, complaint themes, response speed | 15% | Net positive with low defection risk |
| AI answer presence | Recommendation rate and position across 3+ engines | 15% | Named first in most category prompts |
The weighting is the opinion. Demand and AEO visibility carry the most because they sit earliest in the buying decision, where a point gained compounds. A 5-point gap in a low-weight dimension should not drive strategy. A 2-point gap in a high-weight one should.
Then convert findings into action. This is the only output leadership should ever see. Here is a worked example with the structure filled in.
| Finding | Evidence | Decision | Owner | KPI | Review date |
|---|---|---|---|---|---|
| Rival owns "best vitamin C serum for sensitive skin" in AI answers | ChatGPT, Perplexity, Reddit, reviews | Build dermatologist-reviewed comparison page; earn 3 third-party citations | Content | AI mention rate on prompt set | 30 days |
| Rival reviews repeat "slow delivery" | Review mining, social complaints | Add delivery proof to PDP and ads | Ecommerce | Conversion rate on PDP | 14 days |
| Rival wins 5.8% TikTok engagement on creator collabs | Social teardown, save rate | Test one creator collab format | Brand | Save and share rate | 21 days |
Keep every competitor in a consistent structure so you can compare projects run after run without rebuilding the setup. Run the scorecard quarterly. The first run tells you where you stand. The second tells you who is moving, and movement is the only part that predicts next year.
Score your competitors on a loop, not once. The absolute numbers are interesting. The direction between two runs is what actually changes your plan.
A quick maturity read on where most teams sit. Stage 1 runs a one-time SWOT and never updates it. Stage 2 tracks share of voice and sentiment continuously. Stage 3 adds social and offer teardowns tied to decisions. Stage 4 audits AI visibility across engines and feeds everything into a weighted, recurring scorecard. Most teams are stuck at Stage 2. The gap to Stage 4 is where the advantage lives right now.
Case Study: The Beauty Category in 2026
Beauty is the ideal case study because it is fast, crowded, and platform-dependent, and its dynamics (platform shifts, creator concentration, sentiment volatility, AI emergence) apply to any category where perception drives purchase. The category is still growing: McKinsey's State of Beauty projects roughly 5% annual global growth to about $590 billion by 2030, and Circana reported 7% H1 2026 growth in both U.S. prestige ($17.1 billion) and mass ($39.2 billion) beauty. Growth exists across tiers, so "premium versus value" is not a strategy.
Search surface. The Cosmetify Index shows Huda Beauty reclaiming the top spot, with Kylie Cosmetics and MAC behind it, while K-beauty brand TirTir fell from the top to 41st in roughly twelve months. Medicube is the fastest-growing brand by search interest, up 123% year over year. The displacement speed is the lesson: if your competitive analysis runs annually, you would still be benchmarking a brand the market already left. Demand is also fragmenting into clusters (mass prestige, K-beauty value, luxury heritage) that rarely share keywords, so your search competitor set is cluster-specific, not category-wide.
Social surface. WeArisma's data puts TikTok at $18.1 billion in beauty EMV for 2025, past Instagram for the first time, with the top 100 brands generating $39.9 billion total, up 17.1%. But growth concentrated in the top ten. Regional dynamics also diverge: in parts of Europe, Instagram EMV grew while TikTok EMV fell even as content volume rose, because more brands split the same attention into smaller pieces. Run social benchmarks by region, or a global average will hide the real story.
Earned-media surface. Beauty earned media runs on three source types: creators, beauty press (Allure, Byrdie), and communities (Reddit's skincare and makeup forums). This is where unfiltered opinion lives, and it is the layer that most directly shapes AI recommendations. Scraping category comment sections regularly surfaces specific rival weaknesses (a shade-range complaint here, a price-perception gap there) that no keyword tool returns.
AI surface. When a shopper asks ChatGPT for the best serum for sensitive skin, the named brands gain consideration for free. Across these category prompts, recommendation is winner-take-most: a handful of brands capture the majority of mentions, the cited evidence is overwhelmingly Reddit threads, Allure and Byrdie editorial, and high-review retailer pages, and brand-owned domains are cited rarely. The takeaway is direct: to appear in AI recommendations, earn citations where the engines actually look. AI does not cite your product page. It cites the community's verdict on your product.
How to Adapt the Framework to Your Business Model
The six surfaces stay constant. Their weights change by model.
- B2B SaaS: Over-weight AEO visibility and reputation. Buyers shortlist through review sites, AI answers, and comparison pages. Track G2 and Capterra review velocity, which often accelerates 4 to 8 weeks before a product push.
- Ecommerce and DTC: Over-weight social, creator pull, and offer mechanics. The Meta Ad Library and TikTok Creative Center tell you what rivals test and keep running.
- Retail and omnichannel: Over-weight distribution and loyalty, as the Ulta versus Sephora read shows. Store access is a sampling and data engine, not just shelf space.
- Local and service: Over-weight reviews and local search. BrightLocal's finding that shoppers consult six review sites applies most sharply here.
How to Keep the Collection Clean and Legal
Two operational disciplines decide whether this data is trustworthy.
First, clean your entities before you trust a count. A single brand produces name ambiguity, product-line aliases, misspellings, multilingual variants, and executive names that pollute results. Always exclude the brand's own owned handles when measuring earned conversation, filter obvious bot bursts, and spot-check a sample of mentions for false positives before you report a number. A dirty entity makes every downstream chart wrong.
Second, respect the line between intelligence and intrusion. Reading public reviews, ads, and social posts is transparent, white-hat work. Scraping behind logins, buying private data, or any activity that breaks a platform's terms or requires consent you do not have crosses into risk. Monitoring your rivals to improve your own brand is fair. Using the access to disrupt theirs is not.
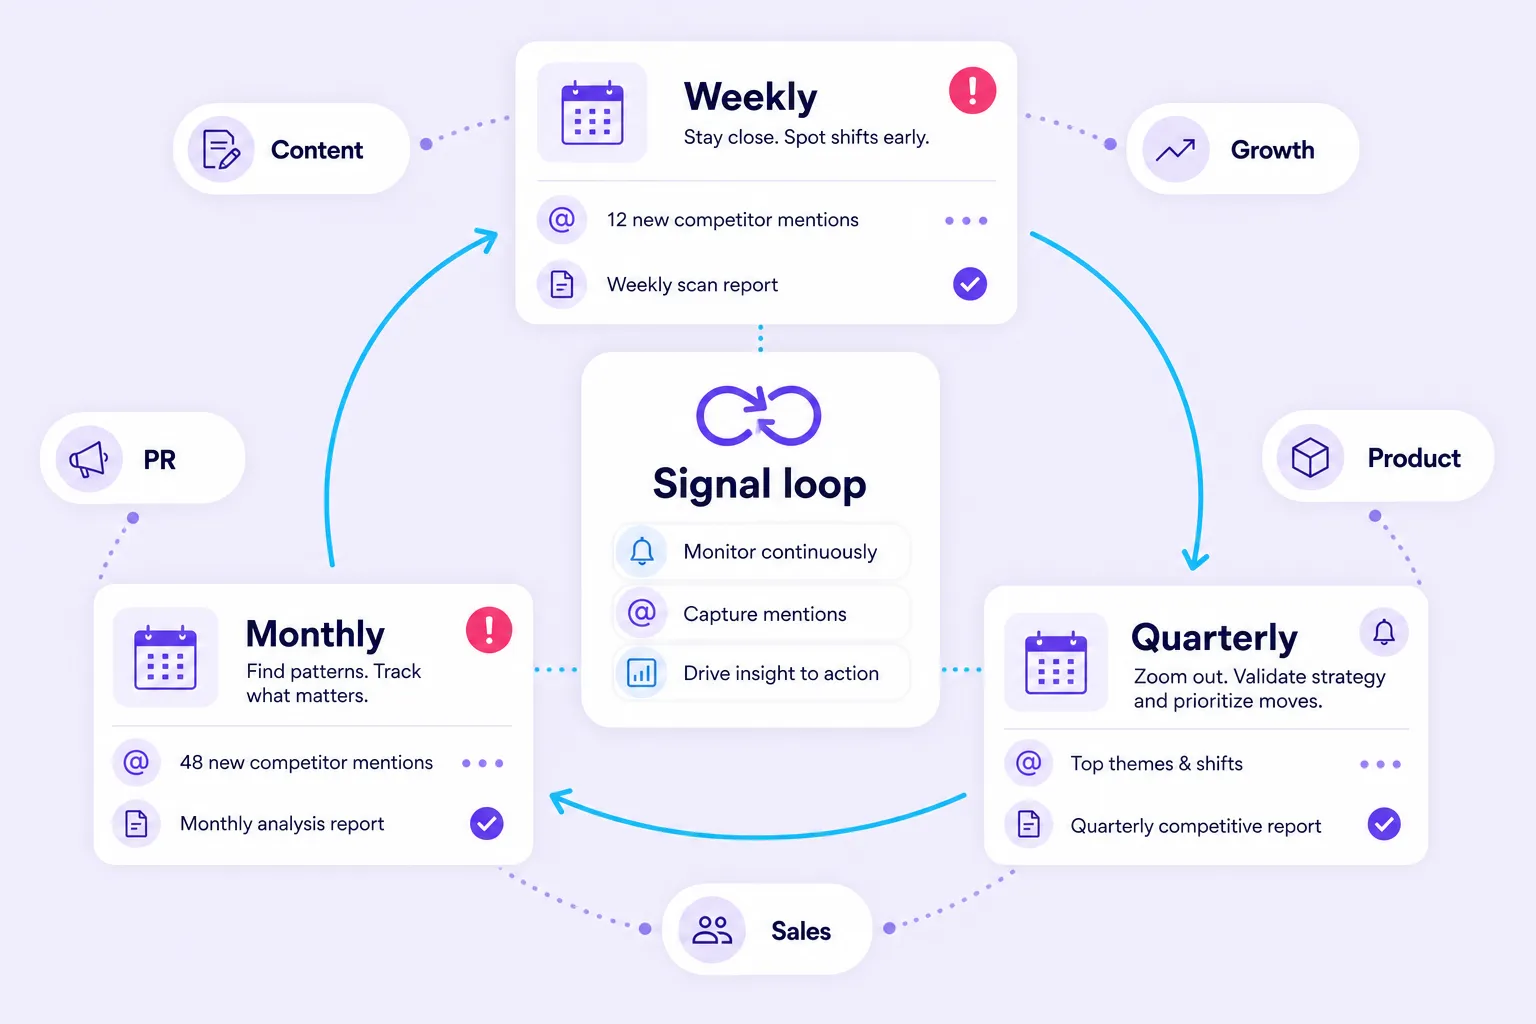
How to Run It On a Cadence, By Role
A competitive analysis that lives in one person's quarter does not survive. Distribute it.
| Role | Weekly | Monthly | Quarterly |
|---|---|---|---|
| Content | AI citation spot checks | Keyword and answer gaps | Full AEO benchmark |
| Growth | Rival ad creative changes | Offer and promo cadence | Channel mix review |
| PR and comms | Sentiment spike alerts | Earned-media narrative shifts | Reputation benchmark |
| Product | Review complaint themes | Feature-request patterns | Roadmap gap read |
| Sales | Competitor mentions on calls | Win-loss notes | CRM list validation |
| Leadership | Nothing | One-page signal summary | Scorecard review and decisions |
Frequently Asked Questions
How often should I run a competitive analysis?
Run a light scan monthly (ad creative, pricing, mention volume, AI-visibility spot checks) and a full scorecard refresh quarterly. Share of voice and sentiment should run continuously with alerts. Trigger an immediate deep analysis any time a rival launches a major product, changes pricing, raises funding, or appears suddenly in your AI-visibility benchmark.
What is the difference between a SWOT and a competitive analysis?
A SWOT is a one-page snapshot of strengths, weaknesses, opportunities, and threats, usually about your own business. A competitive analysis is a deeper, ongoing comparison of multiple rivals across demand, offer, visibility, reputation, and AI presence. SWOT is the frame. Competitive analysis is the evidence that fills it.
Do I need to track AI answer engines for a competitive analysis now?
Yes, and it is the fastest-growing blind spot. With 41.5% of organizations investing in Generative Engine Optimization and Google confirming AI answers run on normal Search fundamentals, buyers increasingly form a shortlist inside an AI answer before visiting any site. If you only audit Google and social, you miss the surface where the shortlist is now forming.
Can a small business do this without expensive tools?
Yes. Start with public sources: Google results, AI answers, competitor sites and pricing, review platforms, the Meta Ad Library, and TikTok and YouTube search. Paid tools add scale, alerts, history, and sentiment at volume, but the thinking matters more than the stack. Buy one tool only once a specific finding would change a real spending decision.
What are the four surfaces of a modern competitive analysis?
The four surfaces are classic search, social and community, earned media, and AI answer engines. A rival you ignore on one surface is usually winning on another, which is why a single-surface analysis consistently misses the competitor that changes your customer's next click.
Which metrics matter most in AI answer-engine visibility?
Track four metrics per engine across at least three engines: mention rate (below 10% of a prompt set means effectively invisible), recommendation rate, average position in the answer, and the exact third-party URLs cited to support each recommendation. The citation sources matter most, because earning citations on those source types is how you change the AI's framing.
Conclusion: Analysis Is a Verb
The brands winning their categories in 2026 are not the ones with the thickest competitor deck. They are the ones who turned competitive analysis from a document into a habit: a recurring loop that reads all three conversations, scores rivals across six surfaces, and feeds one weighted sheet that actually changes the plan.
The macro shift is simple to state and hard to act on. A second shortlist is now forming inside AI answers, built largely from content you do not own, and most teams cannot see it. The brands auditing that surface now will hold the recommendation when buyers ask. The ones who wait will watch their traffic hold steady while their pipeline quietly moves to a rival they never saw coming.
So do not start with a 40-slide deck. Pick five real competitors. Score them on the sheet above this week. Schedule the second run for 90 days out. The first score tells you where you stand. The second tells you who is moving. That gap is the only part that predicts what happens next, and it is the part worth acting on.
Filed under: Growth



1 comment