Unmasking the Secret Pricing Strategies of 755 Successful SaaS Businesses
H alf of every business is creating something that people need. The other half is convincing people to buy it. We’re pretty sure you have plenty of ideas for the first part, so we tried to help you…


H alf of every business is creating something that people need. The other half is convincing people to buy it. We’re pretty sure you have plenty of ideas for the first part, so we tried to help you figure out the second one.
This year, we took the task of seeing how several hundred startups approached the complex issue of pricing and identifying the best practices for you to learn from.
We manually collected and curated data from 775 pricing pages, all belonging to SaaS startups and we created (probably) the most comprehensive pricing pages study.

Below you can find some interesting findings from our study. Yet, for a comprehensive understanding of this matter, we advise you to check out the complete study.
The Perfect Pricing Page Recipe
What’s in A Pricing Page?
How Should You Structure Your Pricing Packages?
What Prices Should You Go With?
What About Enterprise & Annual Plans?
Pricing Pages - Back to or Away from Basics?
Check Out the Complete Study
Key Takeaways
- Community threads dominate. Between 41% and 46% of all tracked SaaS pricing mentions originate in user-generated forums and community threads - the single largest source class, well ahead of editorial content at 23% to 27%.
- Most pricing mentions carry no link. Text-only brand mentions with no hyperlink make up 56% to 61% of all pricing-attribute citations, so the majority of pricing visibility is invisible to a traditional link-equity model.
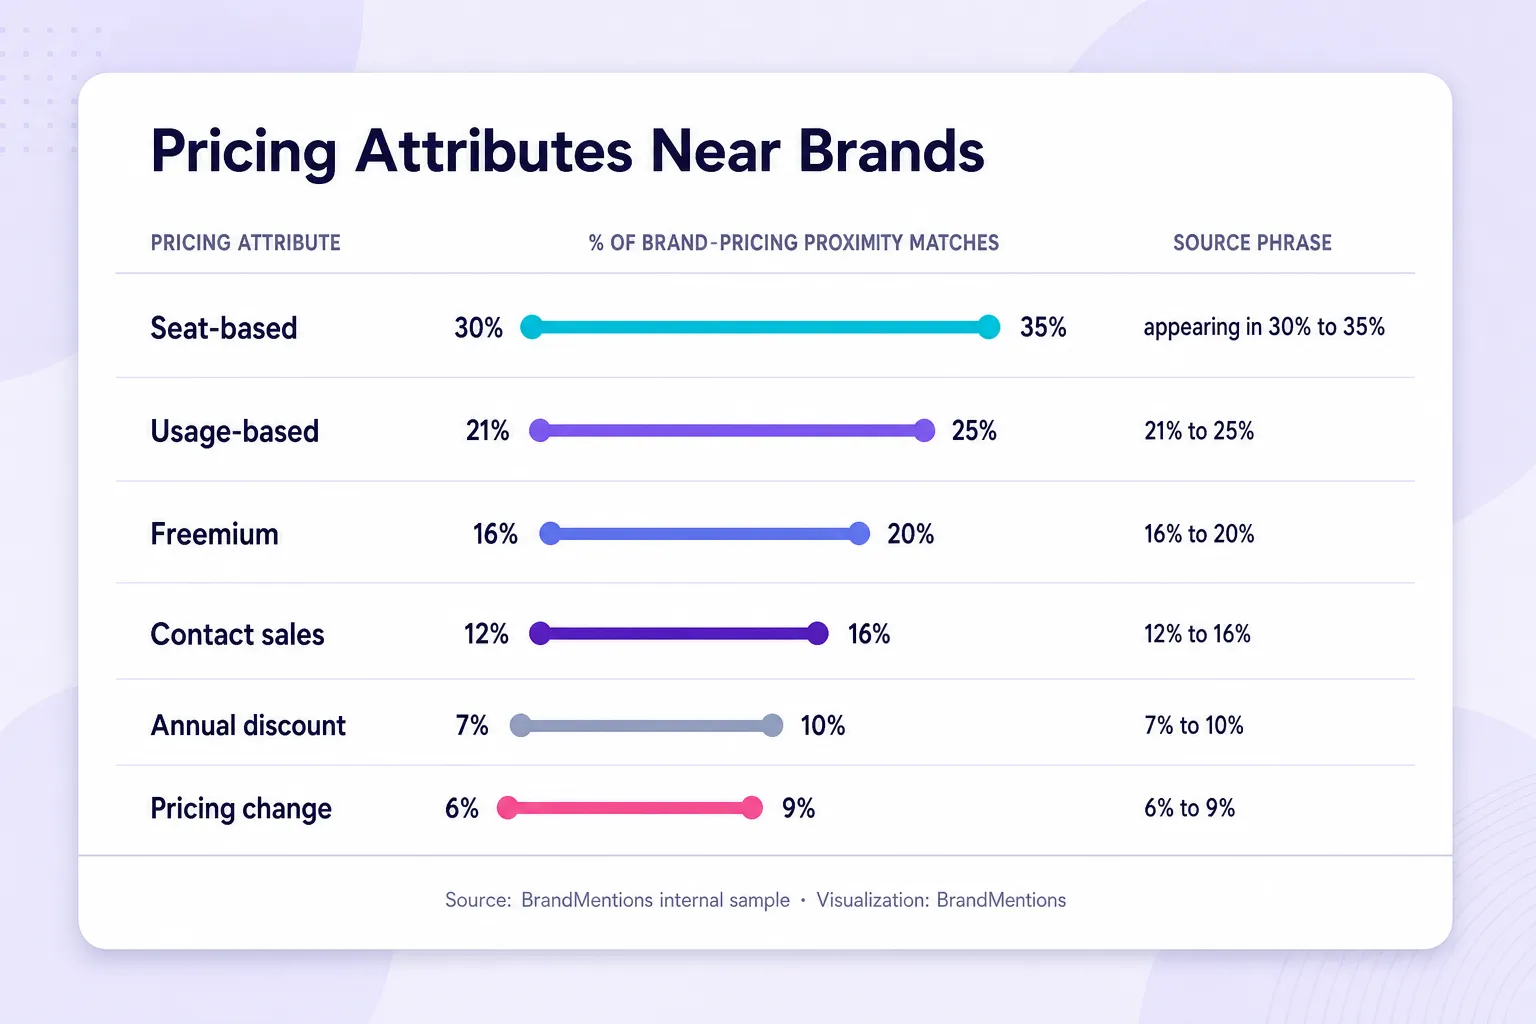
- Seat-based language still wins the narrative. Seat-based terms ("per user," "per seat") are the most common pricing attribute, appearing in 30% to 35% of brand-pricing matches - even as vendor marketing shifts toward usage-based models.
- Nearly one in five companies has no clear public pricing signal. Only 18% to 22% of the 755 companies have a pricing-model association repeated across five or more independent root domains, while 15% to 20% have no strong public proximity signal at all.
Study Abstract
This report examines the source topology, pricing-attribute co-occurrence, and structural placement of publicly visible pricing-strategy claims associated with a tracked lexicon of 755 SaaS businesses. Using an internal sample of approximately 168,000 deduplicated public web mentions gathered over a 90-day window, the study measures where SaaS pricing discourse originates (community forums, editorial teardowns, vendor pages, transcripts, and short-form social), how tightly specific pricing-model attributes cluster around brand names inside a narrow proximity window, how consistently those attributes repeat across independent root domains, and how the claims are structurally rendered on the page (body text, replies, tables, headings, and citation modality). The central finding is that pricing knowledge for SaaS entities is disproportionately community-distributed, largely non-linked, and structurally weak yet semantically rich, which reframes pricing visibility as an entity-clarity and consensus-density problem for Answer Engine Optimization rather than a backlink or on-page problem alone. The analysis is correlational and describes the public web layer only. It does not measure answer-engine retrieval, model weighting, or generated-answer behavior.
What is SaaS pricing visibility? SaaS pricing visibility is how consistently, clearly, and repeatedly the public web associates a company's brand name with its actual pricing model - across independent sources and in formats a machine can read without guessing. It is an entity-clarity problem, not a pricing-page copywriting problem.
Core Baselines
| Metric | Foundational Value | Variance / Distribution |
|---|---|---|
| Tracked public mentions | Approximately 168,000 | 90-day window, deduplicated |
| Tracked SaaS entities | 755 businesses | Tracked lexicon across SaaS pricing language |
| Largest single source class | UGC forums and community threads | Approximately 41% to 46% of tracked mentions |
| Dominant citation mode | Text-only brand mentions, no hyperlink | Approximately 56% to 61% of pricing-attribute mentions |
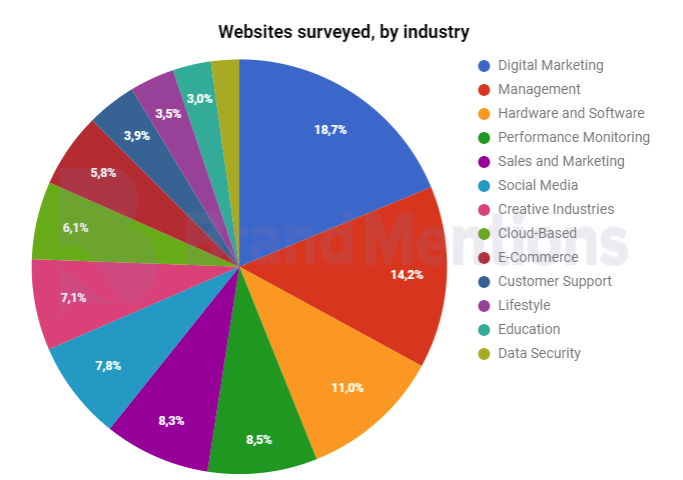
The websites we looked at are all SaaS startups (a business model which has a software as a service) that have been developed in the past five years and come from all walks of industries, from Digital Marketing to Hardware and Software, from Creative Industries to Data Security and from Lifestyle to Management. Some of these are well established, true-and-tried fields, others were the rising starts of the moment, while other still are niche, but likely to explode in the following years.
The Perfect Pricing Page Recipe
Has it happened to you to cook something that looked incredibly easy to do and absolutely delicious (according to the 30 seconds Facebook video)? You followed the recipe step-by-step, did everything by the book but the result was something not even your hungry dog would try. Why is that? Because the result depends on way more elements than you might think: the ingredients, the cooking skills, your oven's quality, the material of the pot and so on.
Same thing happens in pricing approaches.
There really isn’t a general perfect pricing page recipe but you can craft your own successful pricing page. And to do that, you should definitely read our full study for loads of useful findings, good practices and inspiring pricing methods.
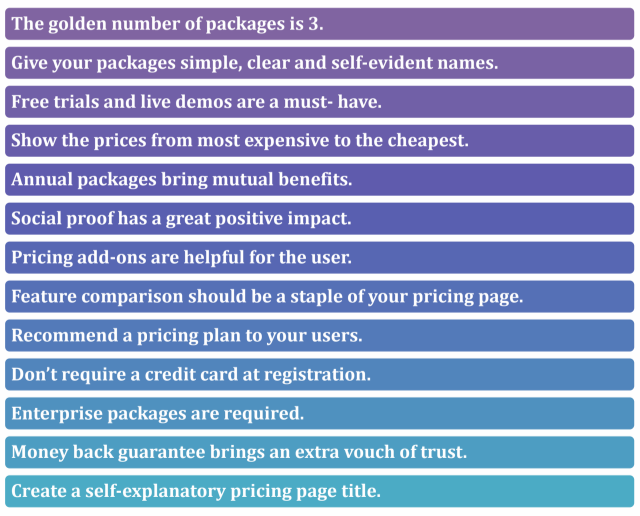
Read the findings, figure out which practices to go by and which to throw out the window and come up with the pricing model that will most satisfy your customers’ needs, as well as your own!
Read it carefully, find insightful answers to a series of important questions as the ones below, and you'll surely find Your perfect pricing page recipe.
- Which Industry Dominates the SaaS World?
- Should You Require Credit Card Info at Registration?
- Which Businesses Have the Cheapest Pricing Plans?
- Which Businesses Have the Most Expensive Pricing Plans?
- Do All Pricing Pages Offer Features Comparison?
- Do Businesses Hide Their Lowest Priced Plan?
- Do All Businesses Offer Discounts for Annual Plans?
- Are Companies Still Listing Their Phone Numbers?
- Do Websites Offer Currency Selection on Their Pricing Page?
- What Else Should You List on Your Pricing Page?
What’s in A Pricing Page?
When we talk pricing pages there’s one important clarification we need to make: despite its name, the main function of a pricing page might not necessarily be about displaying the price.
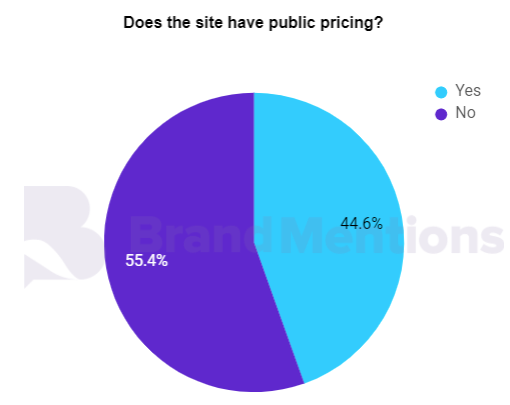
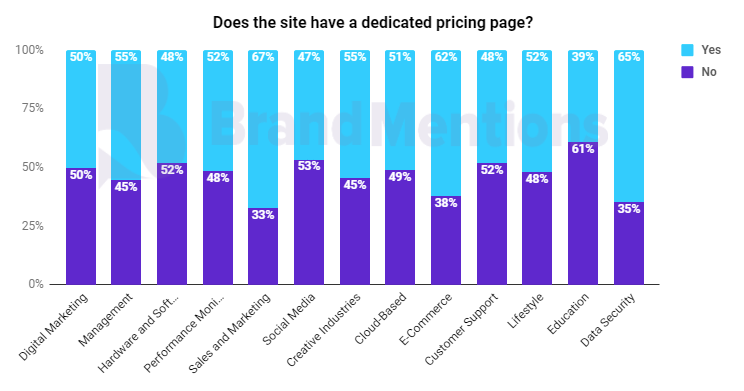
Our results show that while 53% of the websites had pricing pages, just 45% of them had public prices for their product.
Hold on, you might say, you mean to tell me 8% of these websites have a pricing page that doesn’t actually show… prices? And that’s the thing, actually, a pricing page is more about pricing options, rather than the prices themselves.
Even of the websites that have both pricing pages and public prices, many of them have categories where the price is not displayed (usually the “enterprise” package). The categories of pricing are the key to these pages, as they’re much more likely to tell the users what to choose, rather than the price itself (which, due to the abstract nature of the product, could always feel higher or lower than it should be).
The whole idea of a pricing page is not necessarily about the price itself, but rather about market segmentation.
The actual price is less important than factors such as meeting certain criteria, fitting the company strategy or vision, having global capabilities, etc.
That epiphany actually makes the content, design and structure of a pricing page even more important than if it were just about the price, since it’s now both a selling pitch and a negotiation.
It’s not a simple transaction like it would be in a supermarket – “You want this product, it costs this much.” It’s more along the lines of “You want some version of this product and there are several options we provide; we think that if you are part of this category of buyers, you will want this particular version.”
Where Do Buyers Discuss SaaS Pricing?
Between 41% and 46% of all tracked pricing mentions originated in user-generated forums and community threads, making community discussion the single largest source class in the sample. It is a plurality, not a majority, but it outweighs every other category by a clear margin. Traditional editorial and analyst-style content, the format most brand teams optimize for, came second at roughly 23% to 27%.
The distribution inverts the assumption that pricing narratives are shaped by owned pages and long-form articles. Within the community layer the concentration was specific. Reddit communities covering SaaS, startups, entrepreneurship, and individual products accounted for roughly half of the UGC subset. Founder and operator venues such as Indie Hackers, Hacker News, and GrowthHackers made up about one-third, and Q&A-style archives filled the remaining 15% to 20%.
The internal structure of that community layer is where it becomes useful. Pricing knowledge was not published as tidy top-level posts. Direct replies accounted for 38% to 44% of community pricing mentions, exceeding top-level posts at 28% to 34%. Nested comment chains added another 22% to 28%, and moderator, wiki, or sidebar content stayed below 5%. In plain terms, most of the pricing intelligence about these 755 companies lives several clicks deep in a comment thread, written by a user comparing what they actually pay, not by a marketer describing what the company wants you to believe you pay.
This behavior tracks with what independent research on information-seeking has shown for years. Work from the Pew Research Center on how adults use online communities describes exactly the dynamic at play: people treat peer discussion as a primary research surface, and when those discussions are indexed, they become part of the public record a machine can read.
If your brand-monitoring program only watches articles and press, you are missing the layer where SaaS pricing is actually decided. The reply thread is the primary source now, not the footnote.
For teams that run monitoring workflows, this is the recurring blind spot I see in practice. Dashboards get tuned to catch clean editorial mentions and ignore the reply-level chatter, where a "they just doubled their per-seat cost" comment can quietly become the entity's public pricing story. The discipline this calls for is closer to measuring brand awareness at the attribute level than to classic link tracking.
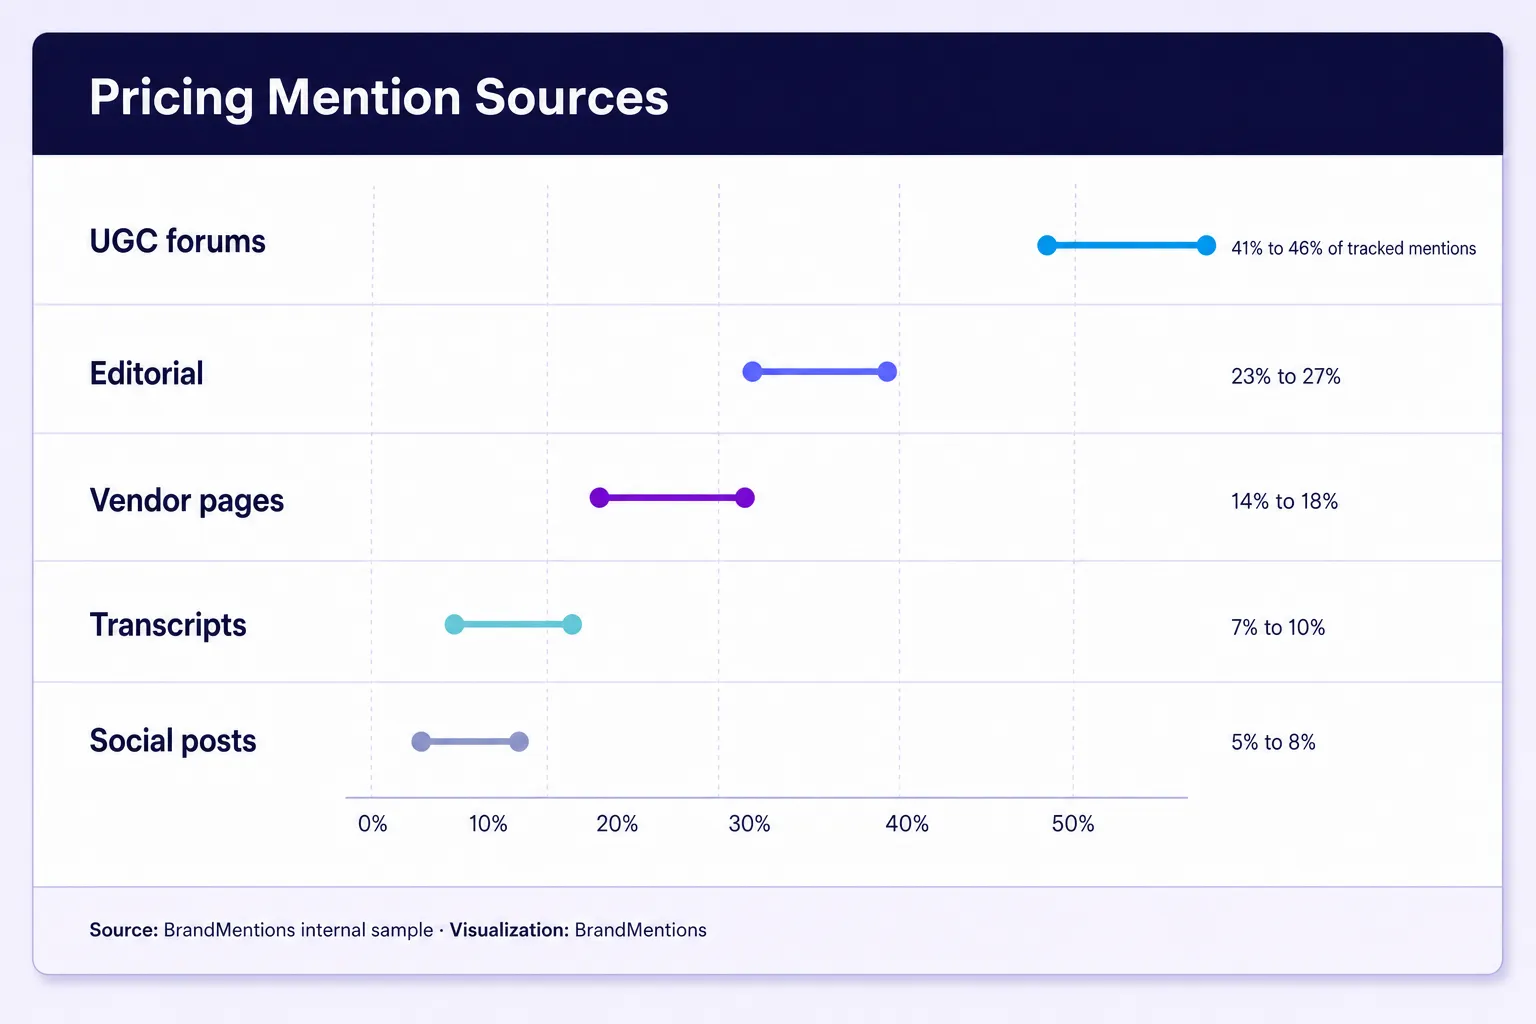
The 2026 Pricing-Mention Source Matrix
The full source topology, ranked by share of the approximately 168,000 tracked mentions, replaces the old inventory of pricing-page screenshots with a distribution of where the conversation lives:
| Source Category | Share of Mentions | Structural Character |
|---|---|---|
| UGC forums and community threads | 41% to 46% | Fragmented, reply-heavy, high experiential signal |
| Long-form editorial and teardown content | 23% to 27% | Structured, consultant-written, comparison-oriented |
| Vendor-owned pages | 14% to 18% | Pricing pages, help-center billing, changelogs, FAQs |
| Public audio and video transcripts | 7% to 10% | Founder interviews, podcasts, reviews, webinar captions |
| Short-form social posts | 5% to 8% | LinkedIn and X style, high velocity, low depth |
And the community layer, decomposed as a share of the UGC subset:
| Community Structure | Share of UGC Subset |
|---|---|
| Direct replies | 38% to 44% |
| Top-level posts | 28% to 34% |
| Nested comment chains | 22% to 28% |
| Moderator, wiki, or sidebar content | Below 5% |
The vendor-owned share is the number worth sitting with. Companies control roughly one mention in six about their own pricing. The other five are written by users, consultants, and interviewers. That ratio is the entire argument for treating pricing visibility as a monitoring and participation problem. It also reframes how you should run a competitive analysis: the richest pricing intelligence on your rivals sits in the same community threads their marketing teams never index.
How Should You Structure Your Pricing Packages?
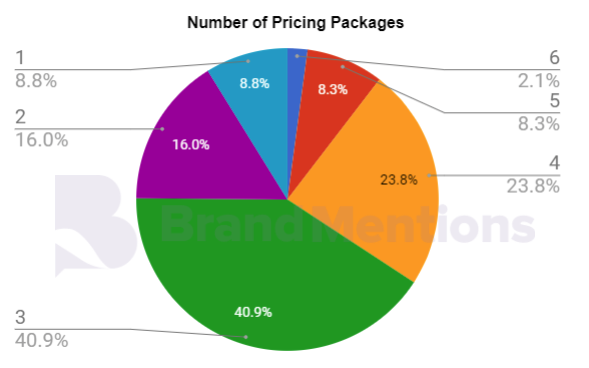
Just how many packages is enough? You’re definitely welcome to try and find the number that best suits you, but of all the websites we’ve looked at, none sets prices packages above 6. So you’ve got yourself an upper limit. For reasons that have to do with logic, as much as strategy, none went below 1 either. Which leaves everything in between as fair game.
But perhaps to no surprise, the magic number appears to be 3 – at least for 40% of the websites surveyed.
And honestly, we can’t really fault you if you decide to go with that, though you should definitely go for a slight variation of it, if that’s a model that better suits you (or if you want to stand out from the crowd). The newer industries definitely feel more at ease with experimenting, as fields such as Performance Monitoring, Creative Industries, or Social Media display the most variety in terms of the number of pricing packages.
So, let’s say you’ve got your doors number 1, 2 and 3 and they’re your pricing packages. Now do you invite your customers to have a peak and try to guide them in the process or do you leave things to fate? Even small things, like the order in which you display these options, can have a significant impact on the decision in certain situations. There’s quite a bit of research on the influence of price presentation order on consumer choice and even though the difference in price between packages is usually significant enough to steer customers on the right track, it’s difficult to argue that in the right context, with 4 or 5 packages where the differences tend to get smaller, there would be no impact to the decision of ordering the packages. Still, most websites are actually pretty straightforward about this.
The vast majority of pricing pages (close to 90%) show packages in the order of cheapest to most expensive (when reading from left to right).
That’s what conventional wisdom would suggest: ease in visitors so that they are met with the most affordable pricing option and get hooked.
Alright, but does this mean that you’re not going to try and nudge your potential clients at all? Not necessarily.
You could still present your options in the classic order, but make door number 2 the prettiest and shiniest door there is. Will it fool anyone? Maybe not. Will it make people think about it a lot more? It sure will.
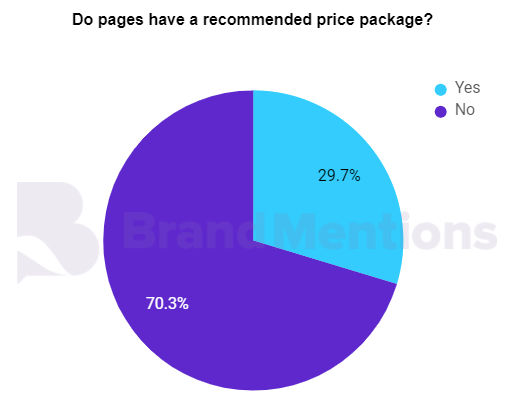
But unless you’re really trying to fill in a certain market niche, that might not be a huge concern to you. In the sample we studied, it turned out not to be a widespread practice (less than 30% of the websites had a recommended price), which might suggest that the majority of companies are either trusting that the site visitors will make the right choice, or they do not care enough about the choice, as long as it involves paying a price.
Of all the industries, Creative Industries and Social Media were most likely to recommend a particular pricing package, perhaps because most companies in these emerging markets have very clear and focused target audiences.
But what if there’s no door at all? It’s more like a huge room with lots of gadgets and you can take as many as you want and combine them and you pay exactly how much you take.
It’s what scalable pricing and pricing add-ons can do. They’re not really widespread practices, but they might turn out to be the way to go in the future.
As companies talk more and more about client centricity, even those currently offering ready-made solutions will have to eventually find ways to at least package it in a more appealing way. Pricing add-ons might prove to be the ultimate customization tool and open up markets that weren’t available before, simply because users didn’t feel they fit into any of the available options.
What Prices Should You Go With?
Okay, clearly most companies will try to make their middle of the road packages as reasonably-priced as possible (not a low price but not a premium price either). What about the extremes, though – the really cheap and the really expensive? Let’s start at the low end and start with the cheapest of all: free options.
Can I use your product but not pay at all if I promise not to use it very much?
The answer is “Yes” for about 30% of the websites in our studies, though there was some variety among industries. It’s hard to spot a particular trend though, as there were both old and new fields that were quite magnanimous with their freemium options (Hardware and Software, but also Cloud Based) as there were others that kept this option on the low (Management, but also Social Media).
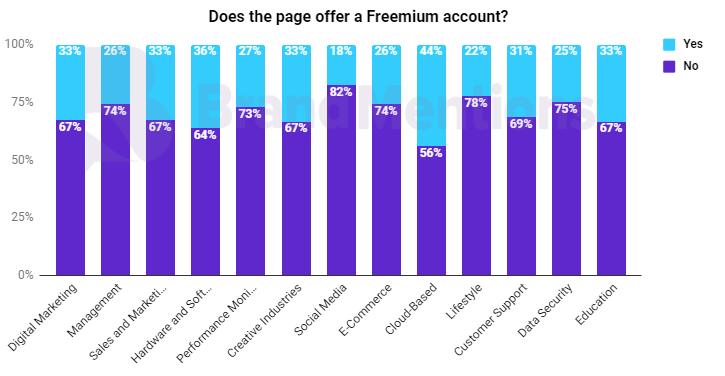
So, the main question when it comes to freemium remains – do you trust those users that they will like/need your product enough to one day make the jump to a paid subscription? Or do you think it’s worth the investment even if they never do? If the answer to either of those questions is “Yes”, you might have enough reason to offer a freemium option.
But what if I want to use a regular version of your product for free, but only for a while, to get a better idea of whether I want to buy a subscription or not?
That’s what you call a free trial and it’s not really that much more spread than freemium accounts.
Overall, a little below 30% of websites are offering this option – which might come as a bit of a surprise if you thought of free trials as a given.
It turns out that free trials are actually a minority in all industries, but they are most prevalent within E-Commerce and Sales and Marketing, areas not at all foreign from the concept of sampling.
Performance Monitoring and Creative Industries, at the other end, seem to be the fields where this practice has the smallest presence. Probably to be expected of industries that are still quite new and are trying to earn the label of “serious” business.
What About Enterprise & Annual Plans?
On the other end of the spectrum, big clients spend big bucks, but just how much does that mean? Well, if you have to ask, there’s a chance you don’t have that kind of money, but it might also be that websites usually don’t really tell you upfront.
Close to 80% of all websites displayed the highest package cost as “Contact Us”, rather than provide an actual figure.
This is likely because the highest priced package is not necessarily a fixed price, but rather a price starting at X and ending at however much the potential buyer is willing to pay. This doesn’t make things necessarily easier – you still need to be very careful about how much you are asking for premium service and how you justify it. But you do have a better chance of making the pitch to someone who can afford it and is willing to pay for it.
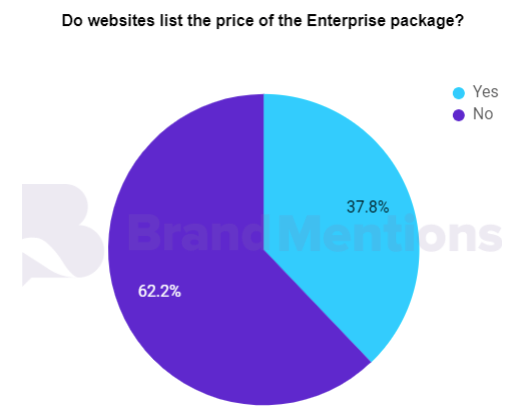
Three times out of four, the most expensive package is labeled “Enterprise”. While not the only package meant for companies, its name signals a certain expectation in terms of size and scope, as well as the level of customer support that is expected.
Most industries, especially the more traditional ones, do not disclose a price for this package, but rather have “Contact Us” as the description.
Websites in Hardware and Software for example have an 80% rate of doing this. Newer fields, such as Lifestyle and Creative Industries, are more likely to actually list a specific price (rather than use “Contact Us”), likely in an effort to establish a benchmark in still growing environments.
Why Cross-Domain Repetition Matters More Than Mention Volume
The more revealing cut is by independent root domain rather than raw volume, because repetition across unrelated sources is what builds a stable entity association.
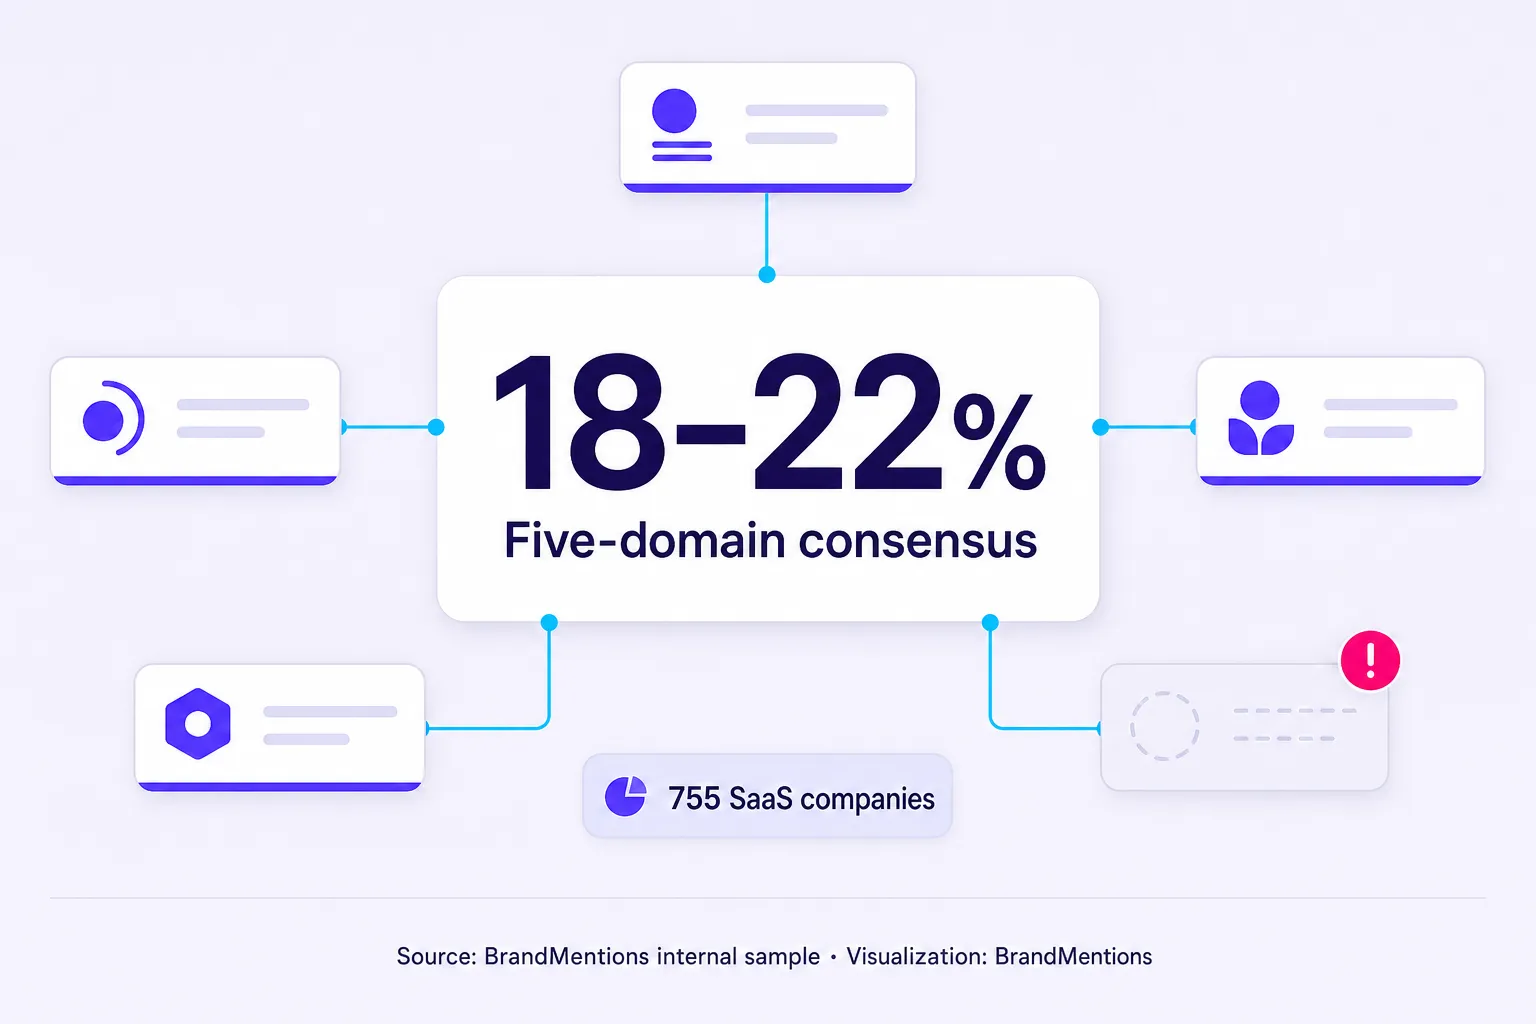
Only 18% to 22% of the 755 companies had a pricing-model association appearing across five or more independent root domains. A further 31% to 36% appeared across two to four domains, 26% to 31% had just one observable root-domain association, and 15% to 20% had no strong public proximity signal tied to any specific pricing model.
| Company-Level Pricing Signal | Share of 755-Company Corpus | AEO Reading |
|---|---|---|
| Five or more independent root domains | 18% to 22% | Stronger consensus density |
| Two to four independent root domains | 31% to 36% | Moderate, still vulnerable to variance |
| One observable root-domain association | 26% to 31% | Weak public reinforcement |
| No strong public proximity signal | 15% to 20% | Low pricing-model clarity |
Read that last figure again. Close to one in five tracked SaaS companies has no clear, repeated public description of how it charges. That is the exact gap answer engines punish. Retrieval systems reward text that unambiguously connects an entity to its attributes, a principle that echoes the entity-attribute structures described in the W3C Semantic Web standards. A pricing model explained only on your own page, and nowhere else, is a single-source claim. Single-source claims are low-consensus by definition.
Consensus density beats a single authoritative page. A pricing model described the same way across five independent domains gives an answer engine cleaner evidence than one flawless pricing page that nobody else repeats.
The attributes with the weakest cross-domain consistency were discounting, contract terms, and custom enterprise pricing. Those live in scattered anecdotes ("I got 20% off on annual," "they quoted us custom") rather than stable documentation. If your differentiation is a discount structure or an enterprise posture, the public web currently records it as noise. That gap is closer to an opportunity to generate leads from your competitors' pricing conversations than most teams realize, because the companies with clean, repeated pricing attributes are the ones getting cited when a buyer asks an AI to compare options. For the on-page side of how these companies package tiers and gate enterprise plans, the companion pricing study documents the pricing-page layer of the same subject.
Pricing Pages - Back to or Away from Basics?
What about the classic marketing tools when it comes to selling things?
Does anybody still do demos, testimonials, money back guarantees, or are all these things outdated?
It turns out that most of these practices aren’t that common anymore, but some might still be worth the effort. Social proof isn’t as common as one might expect, but it’s still a valuable tool for a third of the websites. It’s difficult to say why this isn’t a more common practice, but it might just be that consumers, in general, have become a lot more skeptical about marketing tactics and are less inclined to trust anyone else’s but their own experience.
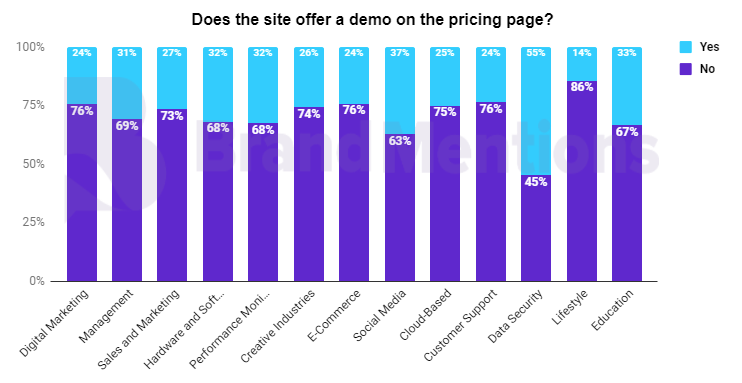
Things are somewhat similar when it comes to live demos as well. Just a little over a quarter of websites offer demos. Markets which seem to focus most on a demo-approach are Data Security, E-Commerce and Performance Monitoring. It might be that in these fields, to a larger extent than in others, the value of what you’re buying is most easily apparent when you can see the product in action, rather than read specs about it or watch presentations of it.
That’s not to say we’ve done away with testimonials altogether, as new industries in particular (such as Cloud-based) seem to find them very valuable in establishing their value in the market.
One practice that we may not see much of anymore is the money back guarantee.
Most examples of money back guarantee offers were from the Hardware and Software field, but even there, they only represented less than 10% of all websites. It’s difficult to say with certainty who’s the main “culprit” behind the disappearance of this practice, but the smart money is on the rise of affordable packages, coupled with free trial and freemium options, which ultimately make the money back guarantee kind of redundant.
How Much Does a Dollar Cost?
Most of the things people make and sell for a living can be divided into neat product units. If you’re a bread maker, every loaf you make will have a certain price which would ideally both cover the expenses for making it and the necessary profit that would ensure you’re left with a decent amount of money for a comfortable living.
If you’re a photographer, things get a bit more complicated, but you could still charge by the photograph. Or, depending on the situation and your context, you might choose to charge by the hour. The latter option might also be a popular choice if you’re a lawyer, or any other consulting-based profession.
But what if you’re a software developer? The product you’ve developed might have taken a considerable amount of hours to finalize and it might take some hours still if you wish to offer support to your customers. It might also require different resources, depending on the extent to which its users will wish to test its capacities. So, what are the price points now? How do you set the price to maximize profitability?
The question becomes less about the actual price and rather about how to communicate the pricing options to your audience.
And you have to do this in a way that is easy to understand for your potential customers and gives them enough options to be tempted into buying in (but also guarantees that you will, in the end, be able to cover your expenses and make a profit). Seems difficult? It is. Yet, this is why we came up with this current study; to help you better understand the market you're competing in, to overcome your pricing challenges and to help you craft your perfect pricing page.
Within your marketing strategy, you've probably tried dozens of pricing structures to determine pricing that will drastically improve sales. Price skimming, premium price, psychological pricing, predatory pricing, promotional prices, price discrimination, price anchors, penetration price, valuebased pricing, reference pricing, bundle pricing or economy pricing, and the list can continue. You've probably tried several type of pricing strategy (or at least you've read a lot about consumer psychology) with the hope of finding the best product pricing strategies for both you and your customers.
The truth is that correctly pricing your products is not easy. But it's a highly important part of your marketing mix. This current research is not the "ultimate guide for saas businesses to improve sales in three days", "the guaranteed for success SaaS pricing strategy"or "the key to SaaS pricing all SaaS customers will fall for." Because honestly, we don't think that such a business strategy even exist. But it's a comprehensive study, performed on a representative SaaS companies that can offer you a competitive advantage in your encounter to determine pricing.
The 2026 SaaS Pricing Visibility Matrix
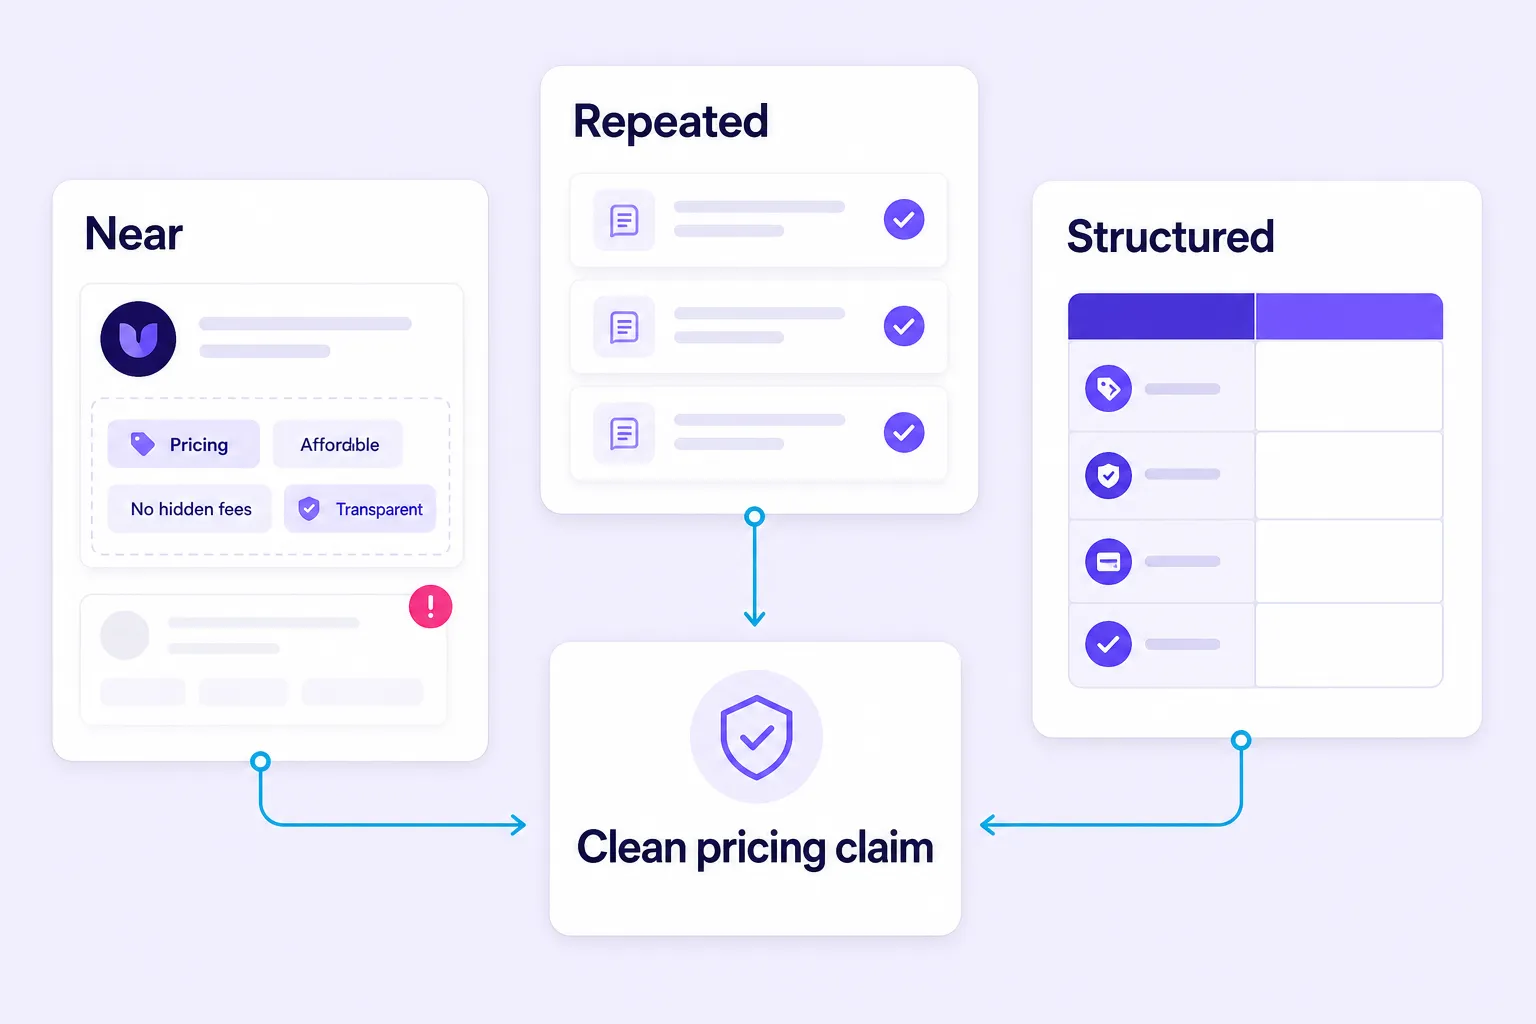
The consolidated view. This matrix does not rank companies. It ranks the structural durability of pricing claims by how they appear in the public web layer, which is the visual asset that replaces the pricing-page screenshots earlier studies of this kind relied on.
| Visibility Layer | Strongest Observed Pattern | Weaker Observed Pattern | Empirical Implication |
|---|---|---|---|
| Source topology | UGC forums and threads, 41% to 46% | Short-form social, 5% to 8% | Pricing claims are discussion-led, not post-led |
| UGC structure | Direct replies, 38% to 44% of UGC | Moderator/wiki/sidebar, below 5% | Operational detail sits below the original post |
| Attribute proximity | Seat-based terms, 30% to 35% | Pricing-change terms, 6% to 9% | Simple model labels travel better than event-based updates |
| Root-domain consensus | Five or more domains for 18% to 22% | No strong signal for 15% to 20% | Only a minority show broad public reinforcement |
| Structural placement | Core body text, 44% to 49% | Boilerplate/navigation, below 5% | Evidence lives in main text, not template areas |
| Citation modality | Text-only, 56% to 61% | Transcript-only spoken, 6% to 9% | Non-linked references dominate the record |
| Extraction clarity | Tables and grids, 10% to 14% by modality | Unstructured social snippets | Small structured formats carry the cleanest pairs |
A clean pricing claim has three properties. The brand name appears near the pricing attribute. The claim repeats across more than one independent source. The placement keeps the attribute close to the entity, especially in tables, comparison blocks, clear replies, or body paragraphs. A weak claim has the opposite pattern: it appears once, far from the brand name, inside an old thread or a thin social snippet with no confirming source. That difference is invisible if the analysis only checks whether a company has a pricing page. In this corpus, the pricing page is one input among many, necessary as the canonical reference but not sufficient to define the public record.
There is an operational trap worth naming here. A pricing-page redesign can improve buyer navigation while reducing textual clarity for extraction. If a page swaps explicit "per user" wording for visual plan cards, the human experience may improve while the machine-readable entity-attribute signal gets weaker. Conversion design and extraction clarity are separate outcomes, and this study measures only the second.
Anomalies & Edge Cases
Three data points defied the expected pattern and are worth isolating from the statistical noise.
A 7% to 10% transcript layer that punches above its weight: Public audio and video transcripts carried a small share of total mentions, but they were disproportionately the origin point for pricing-model claims that later reappeared, reworded, in written community threads. Audio tools output flat text with little HTML structure, which forces the brand name and the spoken pricing attribute into immediate proximity. A founder stating a pricing philosophy on a podcast appears to seed downstream text discussion. This is correlational, and the sample cannot prove direction of flow, but the timing sequence within the 90-day window recurs often enough to flag rather than dismiss.
A 15% to 20% "no strong signal" cohort that is not random: These companies were not evenly distributed. They skewed toward two opposite extremes. Very early-stage entities with thin public footprints, and heavily enterprise-gated companies whose pricing sits behind "contact sales" and therefore generates little describable public attribute language. Some of these companies had reasonable overall mention volume; the discussion simply centered on features, use cases, or comparisons without ever attaching a pricing model to the name. Both ends produce the same result (silence) for opposite reasons, which is a reminder that a missing signal is not automatically a small company. For an answer engine asked "how does Company X charge," that silence produces no clean association to surface.
A 6% to 9% pricing-change cluster with outsized interpretive weight: Annual-discount language (7% to 10%) and pricing-change language (6% to 9%) were the noisiest attributes in the set, dominated by one-off anecdotes rather than repeated description. The edge case within the edge case is temporal. A single viral thread about a price increase can spike a company's "pricing change" proximity share above its baseline, then decay. Worse, historical forum discussions do not update. A ten-month-old nested comment describing an obsolete tier can remain indexed long after a corrected changelog post, so an engine may report accurate sentiment about an increase while carrying an outdated cost baseline. That volatility is real signal about sentiment but poor signal about model, and conflating the two is the most common analytical mistake this data invites. The same caution applies to free-access claims: treat "has a free plan" or "offers a free trial" as a dated assertion unless confirmed by current owned documentation or several recent independent references, because free access is among the most time-sensitive attributes in SaaS.
Strategic Implications
Based strictly on the distributions in this sample, the direction for the next 12 to 18 months is a widening gap between companies that manage pricing as an entity and companies that manage it as a page.
The share of pricing discourse originating in community and transcript environments is unlikely to fall. Owned pricing pages will stay necessary as the canonical reference, but the practical center of gravity for how pricing gets described will keep moving into distributed, non-linked, structurally clean mentions across the public web. According to BrandMentions' tracking infrastructure, the strongest pricing footprints in this corpus were built from repetition across independent sources, not from a single page. That is the operating principle to carry forward.
Consensus density will separate the durable from the exposed. The 18% to 22% of companies with five-or-more-domain attribute agreement are positioned to be described accurately when a buyer asks an AI to compare pricing. The single-source and no-signal cohorts are exposed to being described incorrectly, or not at all. Closing that gap is a monitoring loop, not a content-calendar task: detect how your model is described across the community layer, confirm whether the non-linked mentions describe it correctly, correct inaccurate proximity claims at the source, and make sure your model is stated in stable, plain language inside comparison-ready formats where extraction is cleanest.
This does not mean every company should expose every number. The data does not support that conclusion. It supports a narrower one. Whatever pricing model you want associated with your brand should be stated simply, repeated across durable public contexts, and kept current, because the older claim outlives the correction more often than teams expect. The companies already treating community presence as a distribution channel, the same instinct behind sound digital marketing trends work rather than one-off campaigns, are the ones with the cleanest public pricing record. For everyone else, the question has quietly changed. It is no longer "what does our pricing page say." It is "does the public web say the same thing about how we charge, five times over, in language a machine can read without guessing." Answer that, and the pricing page becomes what it should have been all along: the reference, not the whole story.
Frequently Asked Questions
Where is SaaS pricing most often discussed online?
Between 41% and 46% of all tracked pricing mentions originated in user-generated forums and community threads, making community discussion the single largest source class in the sample - ahead of long-form editorial and teardown content at 23% to 27%. Within the community layer, direct replies accounted for 38% to 44% of pricing mentions, more than top-level posts at 28% to 34%.
What pricing model is most commonly associated with SaaS companies on the public web?
Seat-based language ("per user," "per seat," "user-based") was the most common pricing attribute, appearing in 30% to 35% of brand-pricing proximity matches, followed by usage-based language at 21% to 25% and freemium or free-trial language at 16% to 20%.
How much of a SaaS company's pricing narrative does it actually control?
Vendor-owned pages accounted for only 14% to 18% of tracked pricing mentions - roughly one mention in six. The remaining share is written by users, consultants, and interviewers across the public web.
Do most SaaS pricing mentions include a link?
No. Text-only brand mentions with no hyperlink made up 56% to 61% of all pricing-attribute citations. Hyperlinked mentions pointing to homepages or pricing pages accounted for only 24% to 29%, which means the majority of pricing visibility is invisible to a traditional link-equity model.
How many SaaS companies have a clear, repeated public pricing signal?
Only 18% to 22% of the 755 companies had a pricing-model association appearing across five or more independent root domains. At the other end, 15% to 20% had no strong public proximity signal tied to any specific pricing model, meaning close to one in five tracked companies has no clear, repeated public description of how it charges.
Filed under: Growth