Share of Voice: Formula, Benchmarks, and How to Measure It Across Social, News, and AI
A source-cited reference on what share of voice is, how to measure it across social, news, SEO, PPC and AI, honest benchmarks.


Quick answer: Share of voice (SOV) measures a brand’s share of a defined competitive total, such as advertising spend, mentions or modeled clicks. Calculate it as the brand’s measured activity divided by the corresponding total for the same competitive set, multiplied by 100.
The input changes by channel (ad spend, mentions, impressions, clicks, AI answer appearances) while the arithmetic stays fixed. Published research links every 10 points of spend-based ESOV to roughly 0.5–0.6 points of annual market-share growth for consumer brands (Nielsen: ~0.5; Binet and Field via LinkedIn’s B2B Institute: ~0.6), and about 0.7 for B2B. In AI answers, AthenaHQ's State of AI Search 2026 found the average brand is named in just 16.3% of category responses while category leaders reach 56.5%.
Key Takeaways
- One formula, many surfaces. SOV is always brand metric ÷ total category metric × 100. Only the numerator and denominator change by channel (spend, mentions, impressions, clicks, AI appearances).
- SOV is a portfolio, not a number. A brand holds at least five distinct SOV figures - paid, social, news, SEO and AI - and they do not move in lockstep.
- ESOV predicts growth, but only for spend. Roughly 10 points of excess share of voice ≈ 0.5 points of annual share growth for B2C (about 0.7 for B2B). The multiplier applies to spend-based SOV only.
- AI answers are the new frontier. The average brand is named in 16.3% of AI answers versus 56.5% for category leaders (AthenaHQ 2026).
- Mention ≠ citation. In AI answers, track whether your brand is named and whether your domain is cited as two separate columns - fewer than half of the top-100 brands overlap on both.
- No denominator, no benchmark. Every SOV figure depends on the competitive set, geography, language, channel, time window and weighting rules. State all six or the number is not comparable.
- Validate against outcomes. SOV earns its place only when checked against share of market, share of search and commercial movement.
Share of voice is the one metric that survives every platform shift and still gets measured badly. The formula has not changed since the 1960s. What changed is the number of places a brand can be loud or silent, and in 2026 the most consequential of those places is an AI answer most teams are not yet sampling with any rigor. This guide treats SOV as a single concept measured across many surfaces, with honest benchmarks, transparent provenance, and the caveats the popular guides drop.
Core Entities Explained
Share of voice is not a single number. It is an ecosystem of related measurements that share one formula but count different things. Mixing the definitions is how teams end up with flawed benchmarks and misallocated budgets.
Classical Share of Voice (spend-based)
Classical Share of Voice is a brand's advertising expenditure as a percentage of total category advertising expenditure, over a defined period, market and channel. This is the original Nielsen-era definition and the input to the ESOV growth model. It measures resource commitment, not audience attention.
Mention-based Share of Voice (earned or conversational)
Mention-based Share of Voice is a brand's mentions across social, news, blogs, forums or broadcast as a percentage of total category mentions. It measures conversation ownership. A brand can dominate spend and barely register in conversation, or the reverse, so this number is not interchangeable with the spend-based figure.
Share of Market (SOM)
Share of Market is the brand's share of category sales, revenue or units. This is the scoreboard, the commercial outcome SOV is meant to predict. SOV is a leading indicator; SOM is the lagging result.
Excess Share of Voice (ESOV)
Excess Share of Voice is the gap between SOV and SOM in percentage points. A brand with 15% SOV and 10% SOM runs an ESOV of plus 5. This single number is the planning lever the whole discipline is built around.
Share of Search (SOS)
Share of Search is the brand's share of category-branded search queries, usually pulled from Google Trends. It sits between input and outcome, a behavioral demand signal that correlates with market share and tends to move before it.
AI Share of Voice (AI-SOV)
In this guide, AI mention share is the number of answers naming a brand divided by the total brand–answer appearances for all tracked brands, multiplied by 100. Count each brand once per answer. Mention rate is the percentage of sampled answers naming the brand; domain citation rate is the percentage citing its domain. These are separate metrics with different denominators.
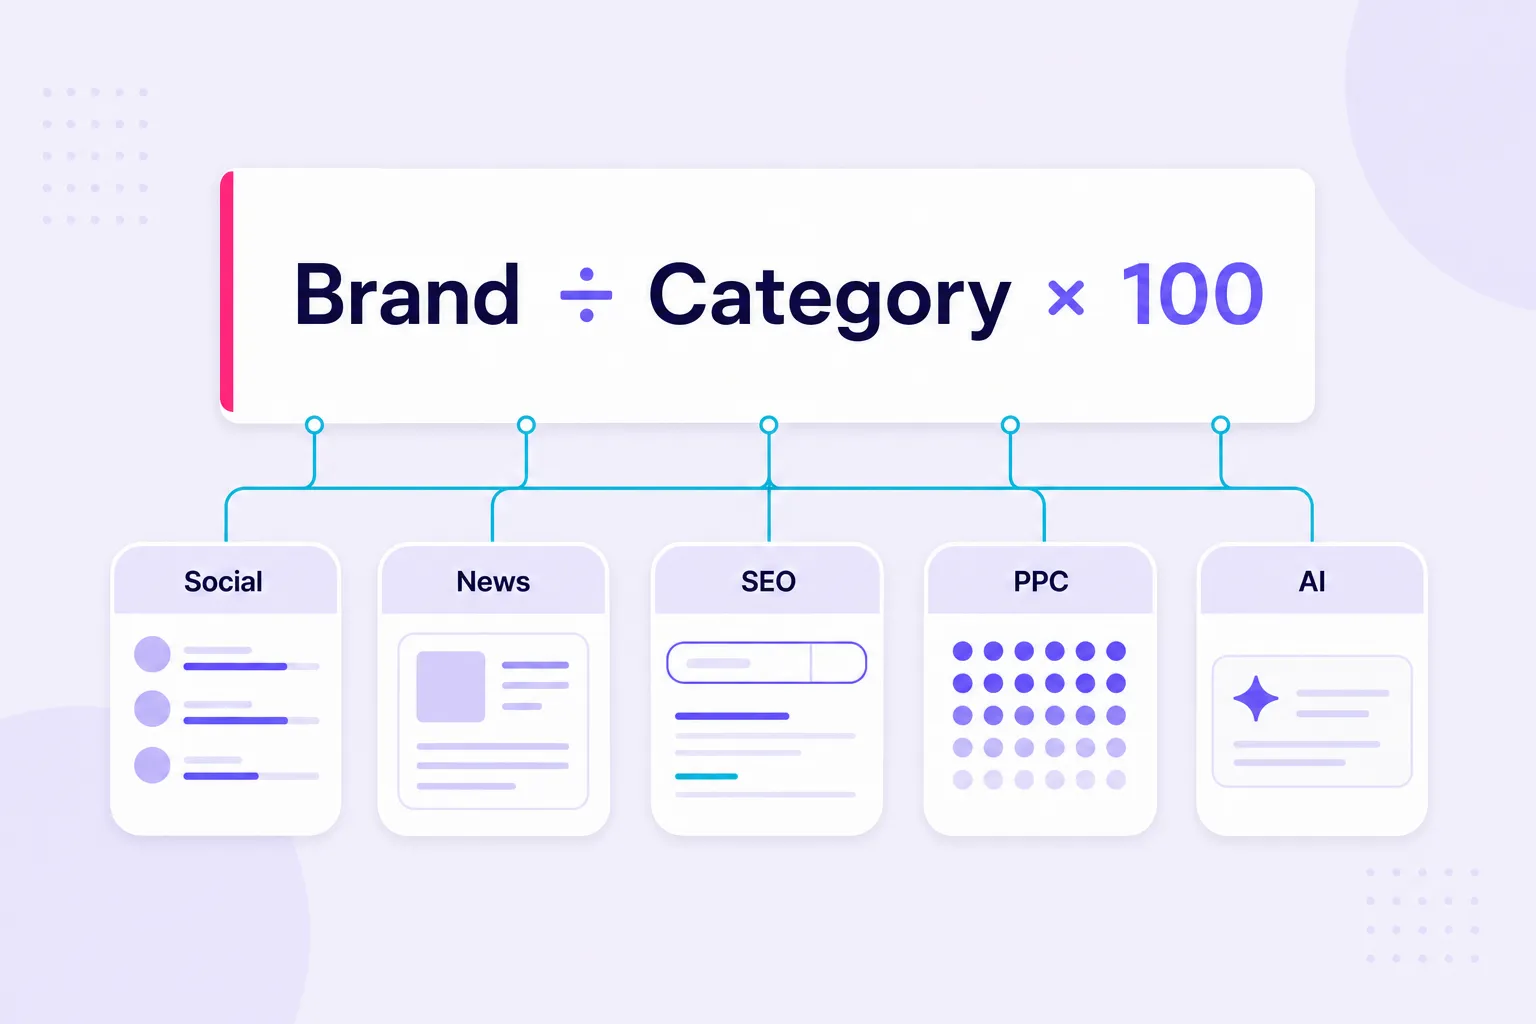
The Universal Formula and Why Every Channel Shares It
Share of voice uses the same arithmetic on every surface: your brand's metric divided by the total category metric for that surface, times 100. The channel only changes what sits in the numerator and denominator, never the structure.
The following table maps each channel to its specific numerator and denominator so you can see the shared formula at a glance:
| Channel | Numerator (your brand metric) | Denominator (total category metric) |
|---|---|---|
| Social SOV | Brand mentions across tracked networks | Total mentions for your brand + fixed competitor set |
| News & PR SOV | Qualifying articles that name your brand | Qualifying articles across the defined competitor set |
| SEO SOV | Estimated organic clicks for your pages (volume × CTR by position) | Total modeled category clicks across the fixed keyword set |
| PPC SOV | Impressions your ads received | Total eligible impressions (platform's eligibility estimate) |
| AI SOV | AI answers that name your brand | Total brand-mention occurrences across the fixed prompt set |
In every row, the calculation is identical: numerator ÷ denominator × 100.
The formula's lineage runs through advertising measurement. The share-of-voice rule was articulated most cleanly by John Philip Jones in Harvard Business Review and later reinforced by the Ehrenberg-Bass Institute and by Binet and Field. In its original form, "voice" was advertising spend. The digital era swapped the input while keeping the ratio intact.
Here is how the same formula reads across the five surfaces that matter in 2026.
Social SOV. Count your brand mentions across the networks you track, divide by total mentions for your brand plus a fixed competitor set, multiply by 100. If your brand is mentioned 4,000 times in a month against a competitive set total of 25,000, your social SOV is 16%.
News and PR SOV. Count qualifying brand–article appearances, counting each brand once per article. If your brand has 38 appearances out of 190 total appearances for your brand and the fixed competitor set, its earned-media SOV is 20%. Weighting by outlet reach or headline prominence refines this, but the ratio is unchanged.
SEO SOV. Use estimated organic click share across a fixed keyword set, weighting each keyword by volume and the expected click-through rate at your ranking position. If your pages capture 12,500 of 100,000 modeled monthly clicks across the category's priority terms, your SEO SOV is 12.5%.
PPC SOV. Platforms hand you this directly as impression share, the proportion of auctions you appeared in versus the total you were eligible for. No manual division is required, but the denominator is the platform's eligibility estimate, not the full category.
AI SOV. Count the answers naming your brand and divide by the sum of answers naming each brand in the fixed competitive set, then multiply by 100. Count each brand once per answer in both the numerator and denominator. Report domain citation rate separately.
If you cannot name the competitive set in the denominator, you do not have a share-of-voice number. You have a volume count wearing a percentage sign.
The denominator is where most SOV reporting quietly breaks. A number built on "your brand plus three competitors you remembered" is not comparable to one built on the full category, and the two will tell opposite stories about the same month. Fix a documented competitive set and a fixed channel definition before measurement, which is really an exercise in competitive analysis more than mathematics.
Share of Voice vs. Share of Market vs. Share of Search
These three get used interchangeably in loose conversation, and the confusion has direct budget consequences.
SOV vs. SOM. Share of voice measures presence; share of market measures result. Today's visibility is what pulls tomorrow's sales, which makes SOV the leading indicator and SOM the scoreboard. Reporting SOV without SOM beside it strips the metric of its predictive meaning.
SOV vs. Share of Search. Share of voice in its purest form is an input, how much you spend or say relative to competitors. Share of search is closer to an output, a record of real behavior pulled from a free public source. Watching them together tells you whether the investment is turning into demand. If your category runs 100,000 branded searches a month and 12,000 are for your brand, your share of search is 12%.
The predictive track record is why share of search earns a seat at the table. Research led by James Hankins across 30 case studies, 12 categories and seven countries found a strong relationship between share of search and share of market, with the relationship varying by category and market. Les Binet's work presented to the IPA established the timing, showing the metric leading market share in automotive, energy and mobile handsets.
Share of search is not frictionless, and the guides that pitch it as a free silver bullet skip its mechanics. Google Trends returns a normalized 0 to 100 index, not absolute volumes, so it cannot be summed or compared across unrelated queries without care. Low-volume brands are suppressed or returned as zero. Brand-name ambiguity (think "Apple" the company versus the fruit, or an acronym that doubles as a common word) corrupts the count. Seasonality, geographic comparability and the choice of category terms all move the number, so a share-of-search series is only trustworthy when those settings are frozen across periods.
Why Did Share of Voice Outgrow Its Advertising Origins?
Share of voice outgrew its advertising origins because consumer discovery fragmented across organic surfaces where attention is earned rather than bought. When television and print dominated, visibility was roughly proportional to budget, so counting spend was enough. Today a brand accumulates "voice" through organic social, Reddit threads, press coverage, podcast appearances, YouTube reviews and AI answers that name it without the brand ever paying for placement or publishing the triggering content.
That expansion created a measurement tension worth stating plainly. Spend-based SOV captures investment. Mention-based SOV captures outcome. The two correlate, but loosely in the short term, which means the number you choose has to match the decision you are about to make.
If you are setting budgets, use spend-based SOV. If you are checking whether your communications are landing, use mention-based SOV. Conflate them and you will make confident decisions on the wrong number.
How to Measure Share of Voice, Channel by Channel
To measure share of voice, apply the same ratio to every channel using its native data source: social and earned mentions from listening platforms, news articles from media-monitoring databases, organic click share from a rank tracker plus a CTR model, impression share directly from the ad platform, and brand appearances from multi-model AI prompt sampling. The sections below detail the data source, the weighting that matters, and the specific blind spot for each channel.
Each surface demands a different data source, and the limits of those sources are the real story. Here is what each channel actually gives you and where it lies to you.
How to Measure Social and Earned Media SOV
This is the noisiest and richest surface. Measurement means ingesting mentions across networks, news sites, blogs and forums, matching them to a fixed competitor set, and layering sentiment so a spike of complaints does not read as a win. The core decision is never collection, it is which mentions qualify as voice, a filtering discipline teams consistently underestimate.
BrandMentions fits a specific niche here: earned-media and social share of voice computed across social platforms, news, blogs and forums in real time, with competitor benchmarking and sentiment in the same workspace. That makes it most defensible when the question is "how much of the public conversation do we own against named competitors?" rather than "which owned post format had the highest native engagement?" For deeper owned-account diagnosis, listening data should be paired with native social analytics tools, because the listening layer answers relative market presence and native analytics answer account performance.
Two refinements matter beyond raw mention share. Engagement-weighted SOV multiplies each mention by its interactions; reach-weighted SOV multiplies by author audience. Both correct for the fact that one mention from a two-million-follower account can outweigh a hundred from small accounts. Bot and spam filtering belongs in this layer too, because an inflated denominator from automated activity produces a share number that describes nothing real.
How to Measure News and PR SOV
News SOV draws from media-monitoring databases that index print, online, broadcast and podcast coverage against a defined media list. Weighting is more common here than in social: most mature frameworks apply at least one of outlet authority, mention prominence (headline versus paragraph twelve), and sentiment. The syndication problem is the quiet distortion, because one wire article republished across 200 regional outlets reads as 200 mentions unless you deduplicate by canonical URL or article fingerprint.
AMEC's Barcelona Principles 4.0 are the reference point for doing this credibly, pushing measurement beyond raw clipping counts toward outcomes and message pull-through. Cision, Muck Rack and Meltwater have genuine strengths in journalist databases and enterprise media intelligence; Brandwatch and Sprout are stronger when the center of gravity is social. The shared limitation is methodological, not moral: when query logic, outlet inclusion and duplicate rules are opaque, the SOV percentage is not comparable month to month, which is exactly the gap that lets the current top-ranking guides publish benchmarks nobody can reproduce.
How to Measure SEO SOV
SEO SOV needs four inputs: a keyword set, ranking data for the brand and competitors, search volume per keyword, and a CTR curve that estimates click probability by position. A position-only model is fragile, because ranking second for a 50-search term should not equal ranking second for a 50,000-search term. The keyword set is the most consequential choice, since a brand that tracks only its own ranking terms will watch SOV rise while missing the category-relevant queries where competitors dominate.
Google Search Console offers an observed partial view of your own impressions and clicks, but it holds no competitor data, so it cannot produce a true SOV. Its real use is validation: comparing your own impression and click trends against a modeled SOV tells you whether the model's direction is right. Report SEO SOV at the topic-cluster level, because a domain can lead "best CRM software" and lose "CRM for nonprofits," and the business decision changes by segment.
How to Measure PPC SOV
PPC is the only channel where the platform supplies the metric. Google Ads defines impression share as impressions received divided by total eligible impressions, with eligibility estimated from targeting, approval status, bids, quality and auction competitiveness. Google also reports absolute top impression share, which measures coverage of eligible absolute-top opportunities. To assess how often delivered impressions appeared prominently, use top and absolute-top impression rates; subtracting impression-share metrics does not provide that breakdown.
The caveat matters more than the convenience. Impression share is calculated inside Google's definition of eligibility, so a brand can read 80% while being absent from a large share of category-relevant auctions it was never deemed eligible for. Impression share measures efficiency within eligibility, not total category coverage, and more paid share is only better when the incremental visibility returns acceptable economics.
On social and news, your SOV is only as honest as your sentiment layer. A brand that is loud for the wrong reasons posts high share of voice and shrinking share of market in the same month, and a raw mention count will never show you that.
Across all of these, SOV should sit inside a wider dashboard of marketing KPIs rather than standing alone, because a share number without a trend line and an outcome metric beside it invites exactly the misreadings this guide is trying to prevent.
Why Does AI Share of Voice Need a Separate Definition?
AI share of voice needs a separate definition because answer engines compress discovery, comparison and recommendation into one generated response, which changes the unit of visibility from "a ranked link a user clicks" to "a named brand inside a synthesized answer the user may never leave." A results page can show ten organic links, ads, a map pack and videos; an AI answer may name three brands and cite five sources. Being fourth on a results page is visible. Being fourth in an AI shortlist usually means being absent.
Platform documentation confirms why this cannot be inferred from SEO rankings alone. Google's guidance on its AI features states that site owners do not need special AI files such as llms.txt, should not use artificial chunking, and should not seek inauthentic mentions, and that Search Console reports performance in generative features. OpenAI's crawler documentation separates OAI-SearchBot (surfacing sites in ChatGPT search) from GPTBot (training), and sites that opt out of OAI-SearchBot will not be shown as search content in ChatGPT answers, although they may still appear as navigational links. Anthropic's crawler guidance confirms its bots honor robots.txt. Crawl permissions, retrieval systems, third-party sources and answer formatting all shape the output, so AI-SOV is its own measurement problem.
AI Share of Voice: Mention vs. Citation, Sampling, and Multi-Model Reality
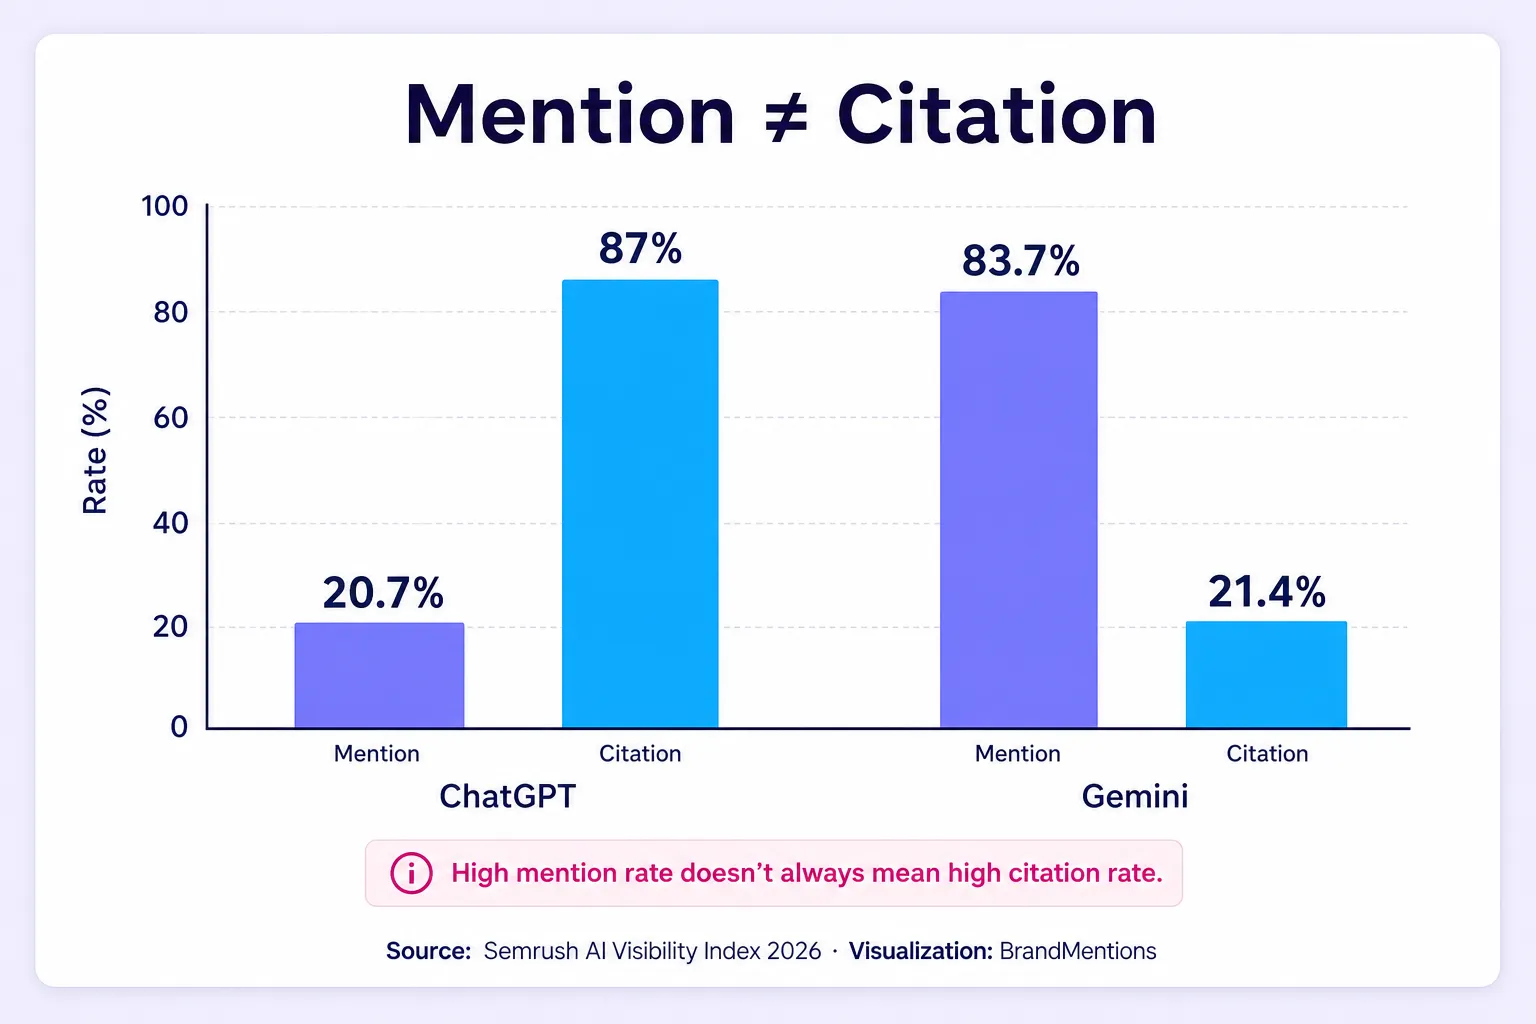
AI share of voice measures how often a brand appears in answers from ChatGPT, Gemini, Perplexity, Google AI Mode and similar engines, as a proportion of category appearances. The complication is that "appears" has two distinct meanings, and conflating them is the single most common error in AI-SOV reporting.
A mention is your brand name written into the answer text. A citation is your domain used as a source for the answer. The 2026 Semrush AI Visibility Index made this split its central finding, drawn from 126 million U.S. AI prompts across 1,200-plus brands and 22 industries (Semrush's current product tracks a larger live query database, so always check which release a figure comes from). The two lists barely overlap: fewer than half of the top 100 most-mentioned brands also ranked among the top 100 cited domains.
The gap flips by platform, which is why a single blended score hides the problem. In Semrush’s separate June 2026 ghost-citations study (3,981 appearances across 115 prompts in 14 countries), ChatGPT’s recorded citation and mention rates were 87% and 20.7%, versus 21.4% and 83.7% for Gemini. A domain earning ChatGPT citations can look strong in a prompt-level tracker yet carry almost no brand recognition with the reader, and a brand earning Gemini mentions can have naming recognition with no citation authority. Two columns, tracked separately, are the only way to see which problem you actually have.
Sampling is the second trap, and it is where most "AI visibility" numbers fall apart. AI answers are non-deterministic and phrasing-sensitive, so a figure drawn from a handful of prompts is noise. A credible AI-SOV program needs a defined prompt universe (discovery, comparison, category, problem and brand prompts), a stated sample size per prompt, repeated runs to measure run-to-run variance, and controls for region, language, logged-out state, device and time of day, because personalization and model updates move results week to week. Report the point estimate, sample size and variation across repeated runs, with a confidence interval where the sampling design supports one. State how prompts and engines were selected and weighted, and keep the entity-extraction rules documented and stable. Repeated runs do not make a convenience sample representative of all user queries.
Multi-model is the third. The engines disagree about who matters, and Semrush found that only 36 of more than 1,200 tracked brands held top-100 visibility across all four major platforms in every month. A single-engine AI-SOV number describes one slice of the surface and should never be reported as "our AI visibility" without the engine named.
This is the layer where BrandMentions extends the classic metric into generative answers, tracking how and where a brand surfaces inside LLM responses so earned-media SOV and AI mention share can be read on the same dashboard and matched against brand AI visibility over time. For the strategy behind earning those appearances, the mechanics of answer engine optimization matter more than any single tracking number. The academic foundation is still young: the 2024 KDD paper GEO: Generative Engine Optimization introduced a framework for improving visibility in generative responses, but its findings describe experimental retrieval settings, not every live AI product.
In AI answers, track mention rate and citation rate as two separate columns, and report both as ranges with a sample size. A brand can be frequently named while its own domain is rarely cited. A blended score can hide that distinction unless its components and weighting are disclosed.
AI Share of Voice in Practice: A Study of 45 Answers Across Four Engines
To check whether the patterns in the large industry datasets hold at a scale any marketing team can reproduce, I ran a small audit in a category I have no stake in: CRM software. BrandMentions is not a CRM vendor, and I ran this test by hand, independently of its monitoring product.
Method. I wrote 15 prompts: five discovery questions (“best CRM software for small business”), five head-to-head comparisons (“Zoho CRM vs Pipedrive for small business”) and five problem-based questions (“how do I track leads without a spreadsheet”). Each prompt received three answers on separate days, rotated across ChatGPT, Gemini, Perplexity and Google AI Mode, which gave 45 answers in total. Sessions were logged out where possible, with geography set to the US and the language to English. For every answer I recorded which brands were named and in what order, and whether each named brand’s own domain appeared as a source. I counted each brand once per answer. The competitive set was defined after collection as the eight brands observed in these answers. The resulting shares describe this exploratory sample and are not directly comparable with future samples unless the same competitive set is retained.
| Brand | Answers naming it (of 45) | AI-SOV (of 123 appearances) | Named first, when present | Own domain cited, when named |
|---|---|---|---|---|
| HubSpot | 37 (82%) | 30.1% | 68% | 68% |
| Zoho | 24 (53%) | 19.5% | 33% | 54% |
| Pipedrive | 24 (53%) | 19.5% | 25% | 54% |
| Capsule | 12 (27%) | 9.8% | 17% | 42% |
| monday CRM | 9 (20%) | 7.3% | 22% | 44% |
| Less Annoying CRM | 7 (16%) | 5.7% | 29% | 57% |
| Freshsales | 6 (13%) | 4.9% | 0% | 33% |
| Salesforce | 4 (9%) | 3.3% | 0% | 75% |
Finding 1: Being named did not mean being cited
The 45 answers produced 123 brand appearances. In 54 of them (43.9%), the brand’s own domain was not among the recorded sources. HubSpot was named in 37 of 45 answers (82.2%), and its domain was cited in 25 of those answers (55.6% of all answers). The difference was 26.7 percentage points; the audit did not measure citations in answers that omitted HubSpot’s name. This is the mention-versus-citation split the Semrush data describes, visible in a sample of 45 answers.
Finding 2: Prompt intent decided whether brands were cited
The citation rate depended heavily on how the question was asked:
- Comparison prompts: 32 of 35 appearances (91%) were cited.
- Problem-based prompts: 20 of 37 (54%) were cited.
- Discovery prompts: 17 of 51 (33%) were cited.
When a buyer names two brands, engines go to those brands’ own pages. When a buyer asks an open question, engines name brands but source the answer elsewhere, typically from review sites, listicles and third-party comparisons. This pattern motivates the discussion below of how owned and third-party sources may contribute to AI visibility.
Finding 3: The buying situation reshaped the shortlist
HubSpot led overall, but the overall figure hid real variation. Zoho was named first in all three answers to the affordability prompt. HubSpot appeared in all 15 problem-based answers, accounting for 15 of the segment’s 37 brand appearances (40.5%), compared with 27.5% in discovery. Separately, it was named first in 11 of the 15 problem-based answers.
Comparison prompts behaved differently again. The two brands named in each question appeared in every corresponding answer, accounting for 30 of the 35 appearances in that group. Salesforce shows why this matters: three of its four appearances came from a question that already contained its name. Comparison visibility is largely built into the prompt, so it should be reported apart from unprompted discovery, or it will inflate the share of any brand that buyers already compare.
Finding 4: Discovery answers varied across the sampled engines and days
The three answers to each comparison prompt always named the same core pair. Discovery answers drifted much more: across its three answers, the “best CRM for small business” prompt named seven different brands, and only two of them appeared every time. A single discovery check would have produced a different shortlist depending on the day and engine.
Finding 5: Appearing and leading are different metrics
HubSpot was named first in 68% of the answers where it appeared. Zoho led in 33% of its appearances, and Pipedrive in 25%, even though the two brands had identical overall shares. Freshsales and Salesforce never came first. Order is not endorsement, since the first brand in a comparison is not necessarily the recommended winner. Still, in a three-brand shortlist, position is a separate signal worth its own column.
What this means
One AI-SOV percentage could not explain how any of these brands entered an answer. Reporting the same data by prompt intent, citation rate and position told a much more useful story. HubSpot’s lead held up everywhere. Zoho’s strength was concentrated in price-led discovery. The smaller brands depended almost entirely on being named in the question.
Limitations. This is an exploratory sample of 45 answers, not a benchmark. Each prompt was answered by three different engines rather than three times by the same engine, and the engines received different prompt subsets (Google AI Mode answered nine prompts, the others twelve each). Because of that, I don’t compare engines here, and run-to-run variation can’t be separated from engine differences. The test also covered only one category, one country and one language, and engine personalization can’t be fully removed even when logged out. Citation checks were made for brands named in each answer and recorded whether their own domains appeared as sources. The audit therefore measures citation rates conditional on a brand mention and does not capture cases where a brand’s domain is cited without the brand being named.
The AI Mention Dependency Map
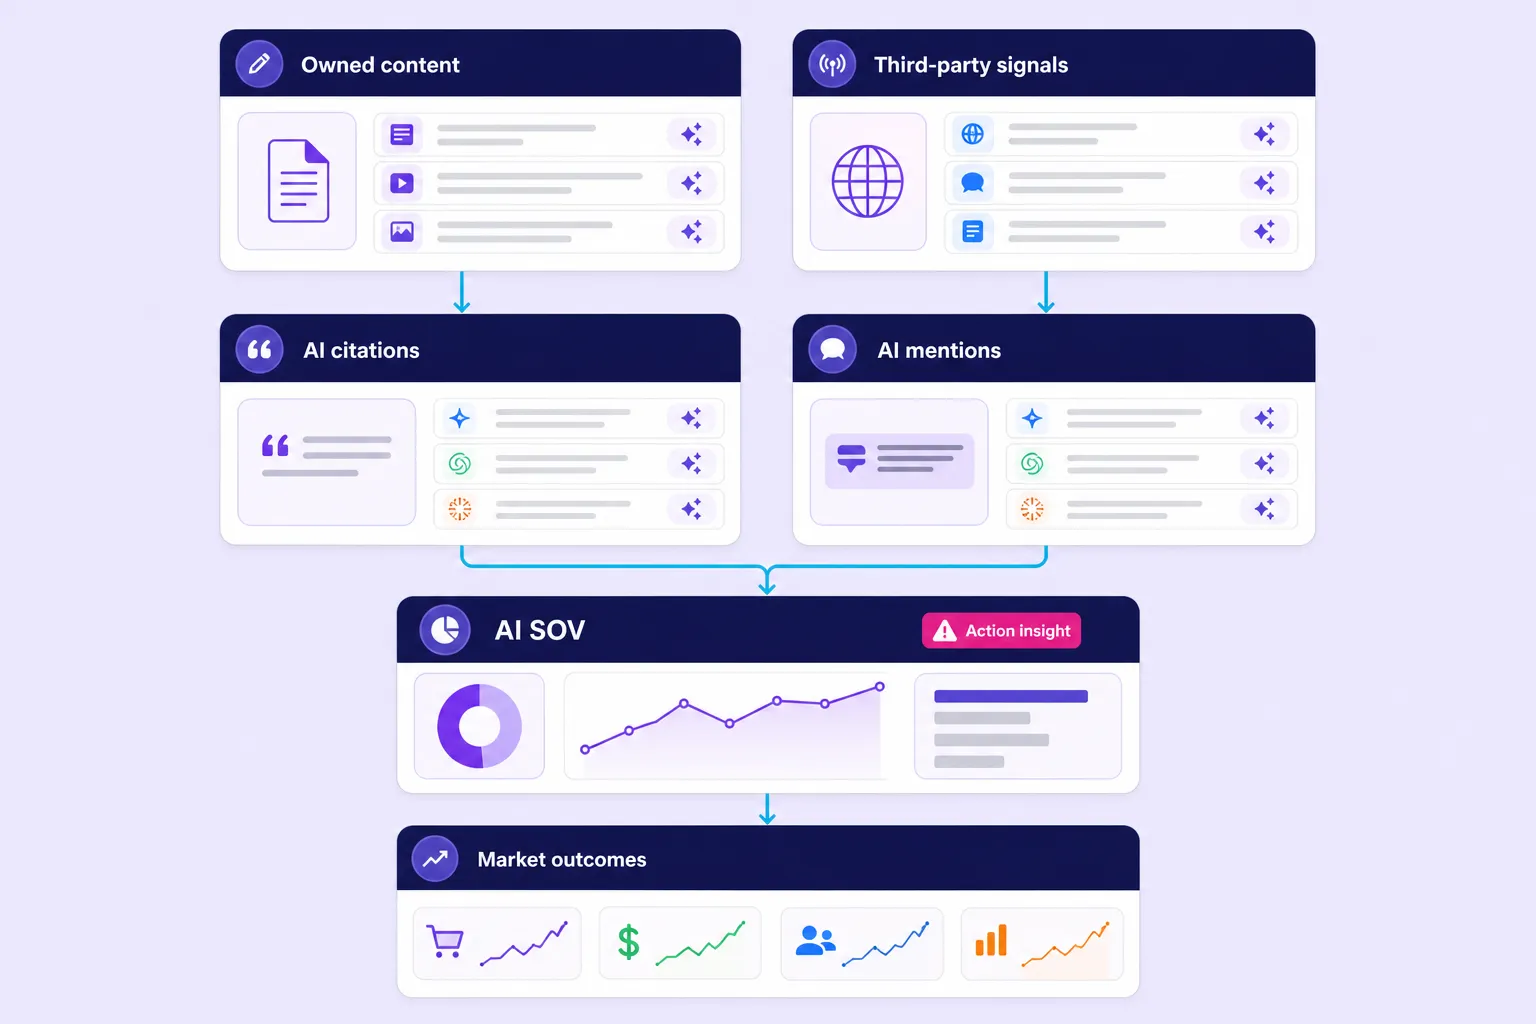
AI mention share does not stand on its own. It is a downstream signal fed by the other forms of voice, and understanding that dependency chain is what separates a measurement exercise from a growth lever. Read the map top to bottom as "what feeds what," ordered from most to least controllable.
| Stage | Inputs | Mechanism | Output |
|---|---|---|---|
| Stage 1 - Feeds AI citation share (most controllable) | Owned content (site, docs, product pages) - crawlable, structured, factually specific | Domain crawl + retrieval | AI Citation Share (your domain used as a source) |
| Stage 2 - Feeds AI mention share (less controllable, third-party governed) | Third-party editorial (reviews, news, comparisons); community discourse (Reddit, forums); structured data / knowledge graph | These signals together surface your name | AI Mention Share (your name written into the answer) |
| Stage 3 - Report mention and citation metrics separately | AI Citation Share + AI Mention Share | Combine | AI Share of Voice |
| Stage 4 - Downstream commercial outcomes | AI Share of Voice | Leads to Consideration → Share of Search → Share of Market | Share of Market |
Owned content and third-party coverage can both contribute to AI mentions and citations. Brands can change their own content and crawl permissions, but engines control retrieval, citation and answer generation. The relative influence of these inputs varies by engine, query and category. A brand that is loud and well-regarded in social, news and community discourse is feeding the exact sources these engines read, which is also why AI-SOV connects back to classic brand work: the inputs that build mental availability are now routed through a model instead of a memory.
AI share of voice is not won with one tactic. It is the cumulative output of how findable, citable, discussable and entity-complete a brand is across the open web. The brands with the highest AI-SOV are the ones that are hardest to not mention.
Benchmarks by Channel and Industry (With Provenance and Caveats)
Benchmarks for SOV are directional, not targets, because every number depends on the competitive set, source corpus, geography and weighting behind it. Each row below names its source, so you can weigh it rather than inherit it. Treat anything presented as a clean universal "good social SOV is 25%" number as a red flag, because no such figure survives a change of denominator.
| Reference point | 2026 figure | Source, date and caveat |
|---|---|---|
| AI mention rate (category average) | 16.3% | AthenaHQ State of AI Search 2026 (Sept 2026 release), across eight LLMs; AthenaHQ’s report PDF gives 17.2% (and 56.7% for leaders); its September 2026 announcement gives 16.3% and 56.5% |
| AI mention rate (category leaders) | 56.5% | AthenaHQ 2026; roughly 3.5x the average |
| AI SOV, #1 brand in category | ~32% | AthenaHQ 2026; falls to roughly 14% by the #3 brand, a steeper drop than traditional search |
| AI domain citation rate (average) | ~14.9% | AthenaHQ 2026; a brand's own domain is uncited in most answers, so descriptions come from external sources |
| AI mention vs. citation overlap | Under 50% of top-100 brands overlap | Semrush AI Visibility Index 2026 (126M prompts, 1,200+ brands, 22 industries); track the two separately |
| ESOV to growth (B2C) | ~0.5 points annual share growth per 10 ESOV points | Binet and Field / IPA Databank; Nielsen’s analysis of 123 brands converged here; applies to spend-based SOV only |
| ESOV to growth (B2B) | ~0.7 points per 10 ESOV points | LinkedIn B2B Institute with Binet and Field; label separately from the B2C figure |
| Share of search to market share | Strong correlation with market share (average r ≈ 0.83 across cases); often leads it | Hankins, 30 cases, 12 categories, 7 countries |
The AthenaHQ figures reframe what "average" means in AI search, and the discrepancy between the 16.3% and 17.2% average mention rate is worth being precise about rather than averaging away. AthenaHQ’s September 2026 announcement reports a 16.3% average mention rate and 56.5% for category leaders. Its report PDF presents a different set of figures: 17.2% and 56.7%, respectively. Cite the exact source for each set; the available figures alone do not establish why they differ. They are not interchangeable, and quoting one without its version is how benchmark drift starts.
No defensible cross-industry PR SOV benchmark exists, and the honest answer is to say so. The metric depends entirely on media-list definition, geographic scope and weighting, and no two monitoring tools share an ingestion corpus, so a 22% in one tool and a 28% in another can both be correct. The same provenance discipline applies to social: a leader holding 47% to 49% in sportswear tells you the category is concentrated, not that half-share is a universal target.
Two structural findings are more useful than any single percentage. First, AI visibility concentration varies sharply by category: in consumer electronics, engines often name only one or two brands per query, while business-services queries spread across four or more, so a 15% AI-SOV signals a very different position in each. Second, these benchmarks are overwhelmingly U.S. and English-language. AI answers, news coverage and social conversation can change dramatically by geography and language, and a global brand that benchmarks only against English U.S. prompts is measuring one market while reporting it as the world.
ESOV and the Growth Link (and the Caveat the Guides Skip)
Excess share of voice is the most durable predictive relationship in marketing, and it is routinely quoted without the one caveat that makes it usable. ESOV is simply SOV minus SOM: a brand with 25% paid-media SOV and 15% market share runs an ESOV of plus 10.
Published research associates positive spend-based ESOV with market-share growth, but the estimated relationship varies by dataset. Nielsen’s analysis of 123 brands across 30 categories reported about 0.5 points of additional market-share growth per 10 ESOV points. LinkedIn’s summary of Binet and Field’s research reports annual figures of approximately 0.7 points for B2B and 0.6 points for B2C. These are historical averages, not guaranteed returns.
The caveat the top-ranking guides consistently drop: the ESOV rule was built on advertising spend, not mentions. Applying the "0.5 points of growth per 10 points of ESOV" coefficient to a social-mention share or an AI-mention share is a category error. Spend is a deliberate investment signal; mentions can be accidental, driven by a crisis or a viral moment that destroys sales rather than building them. Neither the published multiplier nor the direction of the relationship can be assumed to transfer to mention data; test it against your own commercial outcomes.
Two further caveats keep the rule honest. The IPA Databank skews toward awards entrants, which means big-budget, mostly UK, mostly successful campaigns, and the results are correlations rather than experiments. Campaign effectiveness also varies with creative execution, so an average ESOV coefficient should not be treated as a forecast for an individual campaign.
Quote the ESOV growth coefficient only when your SOV is measured in spend.
When SOV is measured using mentions, impressions or AI appearances, do not assume that either the published growth coefficient or the direction of the relationship transfers. Test the relationship against commercial outcomes in your own data.
Why Do Benchmarks Break Without a Denominator?
Benchmarks break without a denominator because SOV is a share metric, and every share metric depends on what counts as the total. The same brand can post 40% SOV against three direct competitors and 8% against the broader category, so a benchmark that hides its denominator cannot tell you whether performance is strong or merely convenient.
A defensible SOV report states six things every time: the market and geography, the language, the channel, the time window, the named competitor set (not "the industry"), and the inclusion and weighting rules. Once those are fixed, SOV becomes a trend metric worth acting on. Change any of them midstream (adding a competitor, expanding the keyword list, adding an AI model) and the new number is not comparable to the old one without restating the baseline. For social and earned-media teams tracking competitors, the set should reflect buyer substitution, not internal politics; if buyers compare you with a cheaper tool, that tool belongs in the denominator whether or not leadership likes it.
Common Measurement Mistakes
The failure modes repeat across every program, and they are almost always definitional rather than technical.
An undefined or self-serving denominator. Quietly leaving out the competitors who are beating you inflates SOV without changing reality. Fix the set before measurement, not after seeing the result.
Counting volume as voice. A rising brand mention count can still mean a falling share if total mentions across the competitive set grow faster. If you are not dividing by a total that moves, you are not measuring share.
Ignoring sentiment on earned surfaces. A crisis generates enormous social and news voice. Reporting that as a win, with no sentiment layer, is how dashboards celebrate the worst month of the year.
Counting syndicated coverage as independent coverage. One wire pickup across 200 outlets is not 200 units of editorial validation. Deduplicate before calculating.
Blending AI mention and citation into one score. These diverge by platform and tell different stories. A single blended number is useless for action.
Under-sampling AI answers and reading one engine. Thin prompt sets and single-model checks produce numbers that change when you breathe on them. Sample repeatedly, across engines, with controls stated.
Applying the ESOV coefficient to non-spend data. Common enough to repeat: the growth multiplier belongs to spend-based SOV only.
Two risks the guides omit entirely deserve a line. There are legal and platform-policy constraints on how this data is gathered: repeated automated querying of AI engines and scraping of social or news data can breach platform terms and data-protection law, so monitoring programs should rely on compliant APIs and licensed data rather than unauthorized collection. And a share number is not an outcome. SOV earns its place only when it is validated against commercial movement through marketing mix modeling, geo-based incrementality tests, brand-lift studies or CRM and pipeline attribution, because a visibility gain that never shows up downstream is a vanity trend with a confidence interval.
Comparison of Measurement Methods
The right method depends on the surface and on whether you need precision or breadth. The honest reading of the table below is that the cheapest and most precise methods cover the narrowest slices, while the surfaces that matter most for 2026 brand-building (earned media and AI answers) are the hardest and least standardized to measure.
| Method | Surface | Data source | Strength | Limitation |
|---|---|---|---|---|
| Spend-based SOV | Paid media | Competitive spend estimates (Nielsen, WARC) | Links directly to budget decisions | Digital spend under-tracked; estimate-dependent |
| Impression share | PPC | Ad platform native report | Platform-defined, objective denominator | Confined to eligible auctions on one platform |
| Organic visibility SOV | SEO | Rank tracker plus CTR model | Granular, keyword-level, actionable | Accuracy depends on keyword set and CTR curve |
| Social / earned mention SOV | Social, news, blogs, forums | Listening platforms with sentiment | Captures earned and community signal | Sensitive to Boolean query design and corpus quality |
| Share of search | Behavioral proxy | Google Trends | Free, early demand signal | Normalized index, not volumes; weak in low-search categories |
| AI mention / citation share | AI answers | Multi-model prompt sampling | Measures shortlist and source presence | Non-standardized, variable, no audited methodology yet |
There is no audited standard for AI visibility, and that is the state of the field, not a gap in any one tool. The IAB published early industry guidance on AI visibility measurement in 2026, which is the beginning of standardization rather than the end of it. Use the IAB’s 2026 measurement guidelines when evaluating AI visibility tools, and require disclosure of sampling, weighting and metric definitions. Published guidelines do not establish that every vendor follows a common implementation or has undergone independent auditing.
Frequently Asked Questions
What is Share of Voice?
Share of voice in 2026 is one metric, brand attention divided by total category attention times 100, measured separately across paid, social, news, SEO and AI-answer surfaces, each with its own data source and benchmark. The two headline reference points are Binet and Field's ESOV rule (roughly 0.5 points of annual share growth per 10 points of spend-based ESOV for consumer brands) and AthenaHQ's 2026 finding that the average brand is named in just 16.3% of AI answers against 56.5% for category leaders.
What is a good share of voice?
For spend-based SOV, exceeding share of market has historically been associated with growth, although outcomes vary. For social, news, SEO and AI metrics, assess performance against a consistent competitive set, your own baseline and commercial objectives. AthenaHQ’s reported mention rates are dataset-specific reference points, not universal minimum targets or AI share-of-voice benchmarks.
How do you calculate share of voice?
Divide your brand's metric by the total category metric for that surface and multiply by 100. The structure never changes; only the input does. On social, use mentions; on news, qualifying articles; on SEO, estimated organic click share; on PPC, platform impression share; on AI, the answers that name your brand across a fixed prompt set. For example, 4,000 brand mentions against a competitive-set total of 25,000 is a social SOV of 16%.
How often should you measure share of voice?
Spend-based SOV and news SOV suit monthly or quarterly reporting because the inputs move slowly, while social and AI surfaces warrant monthly tracking at minimum, with weekly reads during active campaigns. AI visibility in particular shifts week to week as engines re-weight their sources and release model updates, so a quarterly-only AI-SOV number is usually stale before it is read.
What is the difference between AI mention share and AI citation share?
A mention is your brand name written into the answer text; a citation is your domain used as a source behind the answer. They diverge sharply by platform and barely overlap across brands, so they must be tracked as two separate columns. In Semrush’s separate June 2026 ghost-citations study, the recorded appearance-level citation and mention rates were 87% and 20.7% for ChatGPT, versus 21.4% and 83.7% for Gemini. That study analyzed 3,981 appearances across 115 prompts and 14 countries; these percentages do not describe all answers generated by either platform.
Do you need a paid tool, or can you measure share of voice for free?
Paid platforms can make broad, recurring monitoring more practical. Small, clearly scoped audits can also be conducted manually, as the experiment above illustrates. Defensibility depends on coverage, sampling and documented methods, not on whether the tool is paid.
Conclusions
Share of voice is becoming a portfolio metric, not a single number. A brand now holds at least five distinct SOV figures across paid, social, news, SEO and AI, and they do not move in lockstep. You can gain search SOV while losing AI SOV, or dominate social conversation while disappearing from news. Each surface answers a different question, and each is fed by a different set of inputs, which is why a single blended index tends to hide more than it reveals.
The more interesting shift is conceptual. For sixty years, share of voice measured how loud a brand was to humans. The emerging version measures how a brand is represented to machines that then speak to humans on its behalf, shaped by what third parties say rather than what the brand buys. As answer engines mediate more of the buying journey, AI mention share will behave less like an advertising metric and more like a reputation metric, and the mention-citation gap will become the standard diagnostic: frequent mentions with few own-domain citations indicate naming visibility without equivalent source visibility; frequent citations with few mentions indicate source visibility without equivalent naming visibility. Closing that gap, by making your own content the citable source for facts about your brand, becomes a communications objective equal to PR and SEO.
The ESOV relationship, grounded in spend data across decades, remains the strongest empirical bridge between visibility and commercial outcome. The work ahead for the field is to build an equivalent bridge between AI-SOV and market results, and that bridge does not exist yet. The data is accumulating, standardization is starting, and the brands that measure early (with a fixed competitive set, separated metrics, honest provenance and outcome validation) will be the ones holding a usable baseline when it arrives.
Filed under: Digital Marketing