How to Create a Social Listening Report in 2026 (Full Worked Example Included)
An end-to-end guide to building a decision-grade social listening report.


Quick answer: To create a social listening report, define the decision it supports, set your sources and search queries, measure relevant metrics, identify recurring themes, link supporting mentions, explain data limitations, and assign recommended actions to owners with deadlines. State each metric’s formula and each percentage’s denominator. Write the executive summary last and place it first.
Summary
- A social listening report earns its place only if it changes a decision. Name the decision before you pull a single mention, or you are building a dashboard, not a report.
- The scale is why filtering beats collecting. DataReportal's Digital 2026 report counts 5.66 billion social media user identities, equal to 68.7% of the global population. Your job is to surface the few mentions that signal a shift.
- Conversation is split across platforms, not concentrated. Pew Research Center reports 84% of U.S. adults use YouTube, 70% Facebook, 51% Instagram, 37% TikTok, 25% Reddit, and 18% X, so no single network is the market.
- Every rate needs a stated denominator. "62% positive" means nothing until you say positive out of how many classified mentions, over what window, on which platforms.
- Social listening now feeds answer engines, not just social dashboards. Pew Research Center found that in March 2025, 18% of Google searches returned an AI summary and users clicked a traditional result on just 8% of those visits versus 15% without one. What the web says about your brand increasingly shapes what AI answers say about it.
- Write the executive summary last. It is a conclusion, not an introduction, and it should read correctly even if the reader never scrolls past it.
At a Glance: Core Tactics by Goal
Not every brief needs the same report. Match the format to the decision on the table.
- Best for a live reputation threat: The crisis pulse. Real-time volume, sentiment, and reach with source links, refreshed hourly. The skill is catching the one complaint about to spread, not tallying every mention.
- Best for a campaign wrap-up: The before/during/after report. Three fixed windows, the same queries, and a share-of-voice comparison so you can compare changes around the campaign, while accounting for seasonality and other events.
- Best for product and support decisions: Theme and issue clustering. Group mentions into decision categories, rank by volume and sentiment, and attach one verbatim per theme so engineering and support can act.
- Best for a quarterly strategy review: The theme and trend deep-dive. Clustered conversation, sentiment drivers, and competitor positioning over 90 days, built for planning, not firefighting.
- Best for AI visibility: The answer-engine report. Count how often your brand appears in a fixed set of sampled AI answers, then write findings quotable enough for those engines to lift.
- Best for a zero-budget start: The manual sample audit. Hand-pull 100 to 200 mentions, code them in a spreadsheet, and report with an honest sample-size caveat. Slow, free, and surprisingly trustworthy at small scale.
Name the decision before you touch the data, or you will drown in volume and deliver a dashboard nobody uses.
The 7-Part Anatomy of a Decision-Grade Report
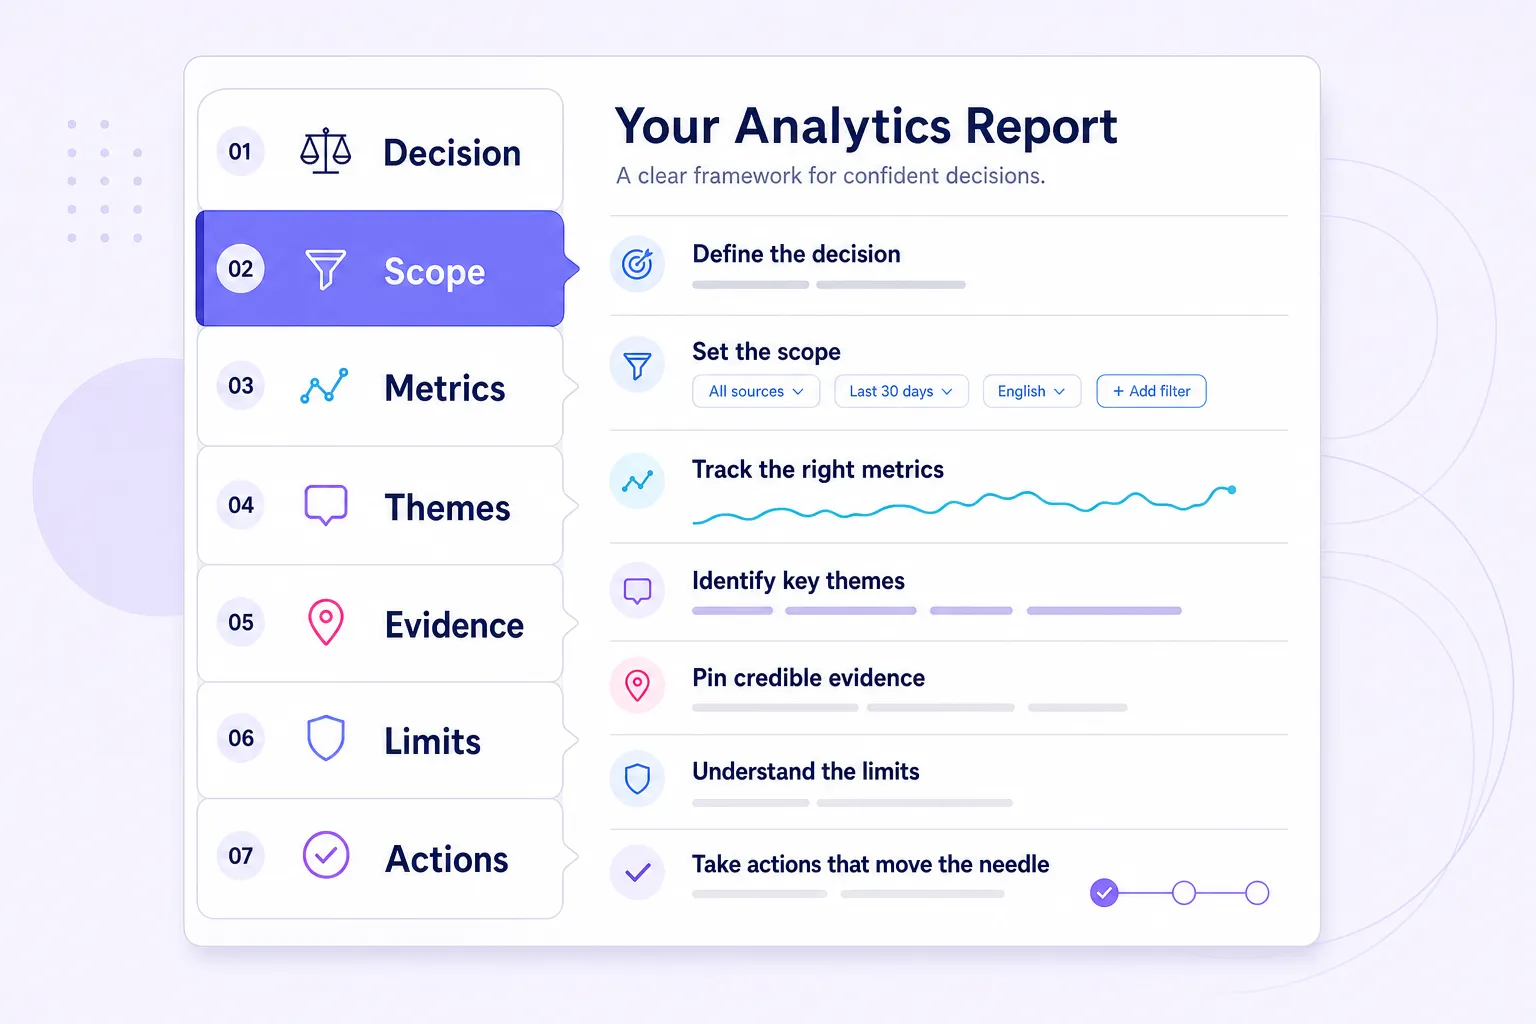
What is a social listening report? It is a document that converts unsolicited public conversation about a brand, competitor, or category into findings, source-linked evidence, and recommended actions a named owner can execute by a specific date.
Every part answers one question. If a section in your draft does not answer its question, cut it.
| # | Section | The question it must answer | Non-negotiable |
|---|---|---|---|
| 1 | Decision | What will we do differently after reading this? | One named decision, in a sentence |
| 2 | Scope | What did we listen to, where, and for how long? | Queries, channels, dates, geography, exclusions |
| 3 | Metrics | How much, how positive, how visible, how fast? | Formulas and denominators stated |
| 4 | Themes | What are people actually saying? | Themes ranked by volume and sentiment |
| 5 | Evidence | Which mentions illustrate each theme? | At least one verbatim or linked mention per theme |
| 6 | Limitations | What could be wrong or missing? | Data gaps and caveats in plain language |
| 7 | Action register | Who does what, by when, measured how? | Owner, action, due date, success metric |
The order in that table is the order a reader sees. It is not the order you build. Define the decision first. Then collect, measure, cluster, verify, document limitations, and recommend actions. Write the executive summary last.
A finding with no owner and no action is not an insight. It is decoration.
How Is a Social Listening Report Different From a Social Media Analytics Report?
A social listening report analyzes what people say about your brand, competitors, and category across the open web. A social media analytics report measures how your owned accounts and content perform. One looks outward at conversation. The other looks inward at your posts.
The confusion costs teams real money. An analytics report answers "did our Tuesday reel beat our Thursday carousel." A listening report answers "is the market blaming us for a shipping delay our carrier caused." Different questions, different data, different owners. Treat the owned-account side as a separate deliverable built with your social media analytics stack, not bolted onto a listening report.
| Dimension | Social listening report | Social media analytics report |
|---|---|---|
| Primary question | What is being said about us and the category? | How is our own content performing? |
| Data source | Mentions across social, news, blogs, forums, reviews | Your accounts and post metrics |
| Core metrics | Volume, reach, sentiment, share of voice, themes | Impressions, engagement rate, CTR, follower growth |
| Owner | PR, comms, brand, product, strategy | Social media manager, content team |
| Decision it drives | Positioning, reputation, product, messaging | Posting cadence, format, creative |
The one-line split: analytics tells you how your megaphone performed; listening tells you what the crowd is saying back.
Does Social Listening Still Matter When AI Answers a Growing Share of Searches?
Yes, and it matters more than it did two years ago. Here is the mechanism most people miss.
AI answers often draw on web content: the mentions, reviews, forum threads, and articles already published about you. Their descriptions can still be incomplete, outdated, or wrong. Pew Research Center found that 18% of Google searches in its March 2025 sample produced an AI summary, that 58% of users had at least one such search, and that links inside the summary itself were clicked in only 1% of visits. For searches that show an AI summary, more of the exposure happens in the summary than in the links.
That reframes the exercise. A listening report is no longer a mood ring for your social channels. It is the input layer for how you show up in AI answers. The point extends beyond search: the Reuters Institute Digital News Report found social and video networks are now more popular than news sites and apps as a source of news in 30 of 48 markets, and weekly use of AI chatbots for news rose from 7% to 10%. Brand reputation travels across social, news, video, forums, and AI surfaces at once. A good media monitoring guide covers the news and blog side those engines lean on.
Public web content may influence AI answers, but inclusion, timing, and wording are not guaranteed.
To track AI visibility in a repeatable way, do not eyeball it. Fix a prompt set (the same 40 to 60 questions every cycle), control for location and device, log the full output and any cited sources, and re-test on a set cadence (monthly is enough for most brands). Report it as a rate: brand citations divided by sampled prompts. Keep the prompt list stable or the number means nothing.
How Accurate Is Automated Sentiment, and Can You Put It in a Client Report?
You can, if you report it honestly. Sentiment is the metric most likely to embarrass you in a client meeting, because the number looks precise and the method is not.
The failure mode is specific. Machines read the words but miss the intent. Sarcasm, irony, regional slang, memes, and quoted complaints routinely break automated scoring. A sarcastic "great, another leaking can" reads as positive to a classifier that ignores context. So treat the automated pass as a first draft, then read the high-stakes mentions yourself. If your team needs to standardize labels, start with sentiment analysis basics before you argue tone in a live review.
The 50-mention rule of thumb: below roughly 50 classified mentions in a window, show raw counts next to every percentage and explain how sensitive the number is. At n = 50, changing a single label moves a category’s share by 2 percentage points; at n = 20, it moves it by 5. This is a working heuristic, not a validated threshold; adjust it to your category’s baseline volume and state the floor you used.
Two moves make sentiment defensible. First, state your method and your check: "machine-assisted, with the top 100 highest-reach mentions and all complaint-tagged mentions reviewed by hand." Second, if you code themes manually, add a sanity check on the coding itself. Have a second person independently code a 10% sample, compare, and resolve disagreements with a written rule. Publish the agreement rate alongside the result; if two trained coders agree on 76% of labels, the reader can judge how much weight to put on the sentiment split. Report how the independently coded sample was selected, how many mentions it contained, which labels were checked, and the agreement before reconciliation. That one habit turns "I felt it was negative" into a repeatable standard, which is the heart of measuring brand sentiment that holds up under questioning.
Can a Listening Report Demonstrate Value Without Revenue Attribution?
Yes. Track decisions informed, time saved, and subsequent outcomes, while distinguishing these from financial ROI.
Few teams can draw a clean line from a Reddit thread to a closed sale. The ones that keep their budget do three things. They attach each finding to a decision that already has an owner and a measurable outcome. They use proxies: cost avoided (a complaint caught before it scaled), time saved, and share of voice moved against a named competitor. And they track whether the public conversation actually shifted after the action.
The empty decision rule: every finding must name an owner and an action. If it does not, cut it, even if the chart is beautiful.

Step-by-Step: Build the Report
Each step carries a non-obvious insight and the failure mode that trips teams up.
Step 1: Define the Decision
Write one sentence at the top of a blank doc: "This report will help [who] decide [what] by [when]." Everything else is scaffolding for that sentence.
This is not a formality. Conversation volume is overwhelming, and the decision is what tells you what to ignore.
The decision test: if you cannot name the decision your data will change, stop and get the brief before you query anything.
Non-obvious insight: the decision also sets your cadence. A positioning decision needs a quarterly deep-dive. A crisis decision needs an hourly snapshot. Teams that run everything weekly are usually reporting on a rhythm that fits nobody's actual decision.
Step 2: Set Scope and Collect Data
Scope is where reports quietly go wrong. Four choices define your dataset: the queries, the sources, the window, and the exclusions.
Your queries are the single biggest lever. A lazy query ("Nike") pulls noise. A precise one separates your brand from the Greek goddess, the local gym, and the sarcasm. Learn proper Boolean query setup with AND, OR, NOT, exact-match quotes, and proximity operators, then save the query string inside the report so the next analyst can reproduce it exactly.
Platform access shapes what you can pull directly, and it is more limited than most marketers assume. The X API documentation states that standard recent search covers only the last 7 days, returns up to 100 posts per request, and caps queries at 512 characters. Reddit's Data API limits free access to 100 queries per minute per OAuth client ID, averaged over a ten-minute window. Recommendation systems also bend what is visible: YouTube says its suggestions weigh watch history, search history, likes, dislikes, "not interested" feedback, and satisfaction surveys, and TikTok says its For You system generally avoids showing two videos in a row from the same creator or sound. Your data is a directional sample of visible conversation, never a clean census.
You can use the BrandMentions app to collect, because it returns real-time mentions across social, news, blogs, and forums in one stream with the source URL attached to every record, and it flags where a brand surfaces in AI-generated answers. That cross-source, source-linked collection is the niche it fills for evidence-led reporting. Whatever you use, the rule is the same.
Before you analyze, clean the set. Remove duplicate records. Track original posts, reposts, quote-posts, syndicated articles, and unique authors separately, and specify which are included in each metric. Record total pulled, total filtered, and the reason.
Report the denominator, not just the number. A finding without a denominator is an opinion with a decimal point.
Non-obvious insight: Use complete, comparable reporting windows. For weekly comparisons, use the same weekdays; flag incomplete periods and account for seasonality. Volume and sentiment both swing on weekends, and a window that closes mid-weekend quietly skews your latest read.
Step 3: Pick Metrics (With Denominators)
Choose the fewest metrics that answer the decision. For most reports that is five to seven: volume, reach, sentiment distribution, share of voice, and a velocity or trend figure. Map them to your existing key performance metrics so the listening report reconciles with the rest of your measurement.
The discipline that separates professionals from amateurs is the denominator. Reach is not “big”: if it is built from follower counts, label it “aggregate potential audience,” count each mentioning account once, and disclose that overlapping followers are not deduplicated. Share of voice is not "we are winning"; it is your mentions divided by the total mentions of you plus a named competitor set, over a fixed window.
The denominator test: if you cannot say "divided by what," the metric is not ready for an executive slide.
Non-obvious insight: reach is the most abused number in the stack because it sums potential audience, not behavior. Report it, but never lead with it. Lead with volume and sentiment, which sit closer to what people actually did.
Step 4: Cluster Themes
Numbers tell you something changed. Themes tell you why. This is the step automated dashboards cannot do for you, and it is where your value as an analyst lives.
Read a sample of the actual mentions and group them into five to seven recurring topics. Make them decision categories, not hashtags. "Price objections concentrate in grocery shoppers" is a theme. "TikTok" and "Negative" are not. Then recompute sentiment per theme, because an 80% positive brand can hide a 90% negative theme about to spread.
Non-obvious insight: the best product findings often hide inside neutral mentions. People casually describe workarounds, substitutions, and unmet needs without ever sounding angry, so a tool that only flags negatives will miss them.
Second non-obvious insight: the theme worth reporting is rarely the biggest. The biggest is usually your baseline chatter. The decision-relevant theme is the one growing fastest week over week, even while it is small. Report velocity, not just size.
Step 5: Attach Evidence
Every claim gets a receipt. If you write "sentiment dropped on shipping complaints," the next line links to at least three real mentions that show it.
The evidence ratio (a rule of thumb, not a law): every major finding needs at least three supporting mentions, or one high-authority mention plus a clear volume pattern. The number is less important than the habit: no claim without a clickable receipt. This kills the classic mistake of building a recommendation around one loud post.
The tool I used in the example (BrandMentions) keeps the permalink, author, reach, and timestamp on every mention, so moving from a theme to a verbatim quote takes one click, not a manual hunt. Source-linked evidence also travels: a finding tied to a public URL can be cited by an answer engine, while one locked in a walled dashboard cannot. If you need the broader workflow for tracking mentions online, build the evidence library as you collect, not after.
A finding your reader cannot click through to verify is a rumor in a nicer font. Link the evidence or cut the claim.
Non-obvious insight: quote mentions verbatim, typos intact. Cleaned-up quotes read like marketing copy. Raw ones read like the voice of the customer, and executives trust the raw ones more. One caution: do not over-quote private individuals. Paraphrase ordinary users, link the source internally, and reserve full public quotes for public figures, brands, and high-reach accounts. In EU and UK contexts, treat screenshots of named individuals as personal data and minimize what you republish.
Step 6: State Limitations
Write limitations before you write the summary, while the gaps are fresh. This is the part competing guides skip, and the part that makes a report trustworthy.
Name five things: your sample (all mentions or a subset), your coverage (which platforms you could and could not access, and the API limits above), your sentiment method and its blind spots, your attribution gaps (correlation is not causation), and anything excluded (private groups, DMs, deleted posts, non-English mentions, lurkers who read but never post). A report that admits its limits is more persuasive, not less.
Non-obvious insight: limitations are where you pre-empt the one question that derails a review. If you know someone will ask "but did you include TikTok," answer it here before they ask.
Step 7: Write the Executive Summary Last
The summary is a conclusion, so you cannot write it until you have one. Keep it to five sentences: the decision it supports, what changed, why it changed, the risk or opportunity that matters most, and the recommended action with an owner and a deadline. One number per sentence.
Place it first. Most readers read only this. Build it so that if they stop there, they still get the decision right.
Decision threshold: if your executive summary does not name a recommendation, you wrote a status update, not a report. Go back and take a position.
The Free Template You Can Rebuild in Any Tool
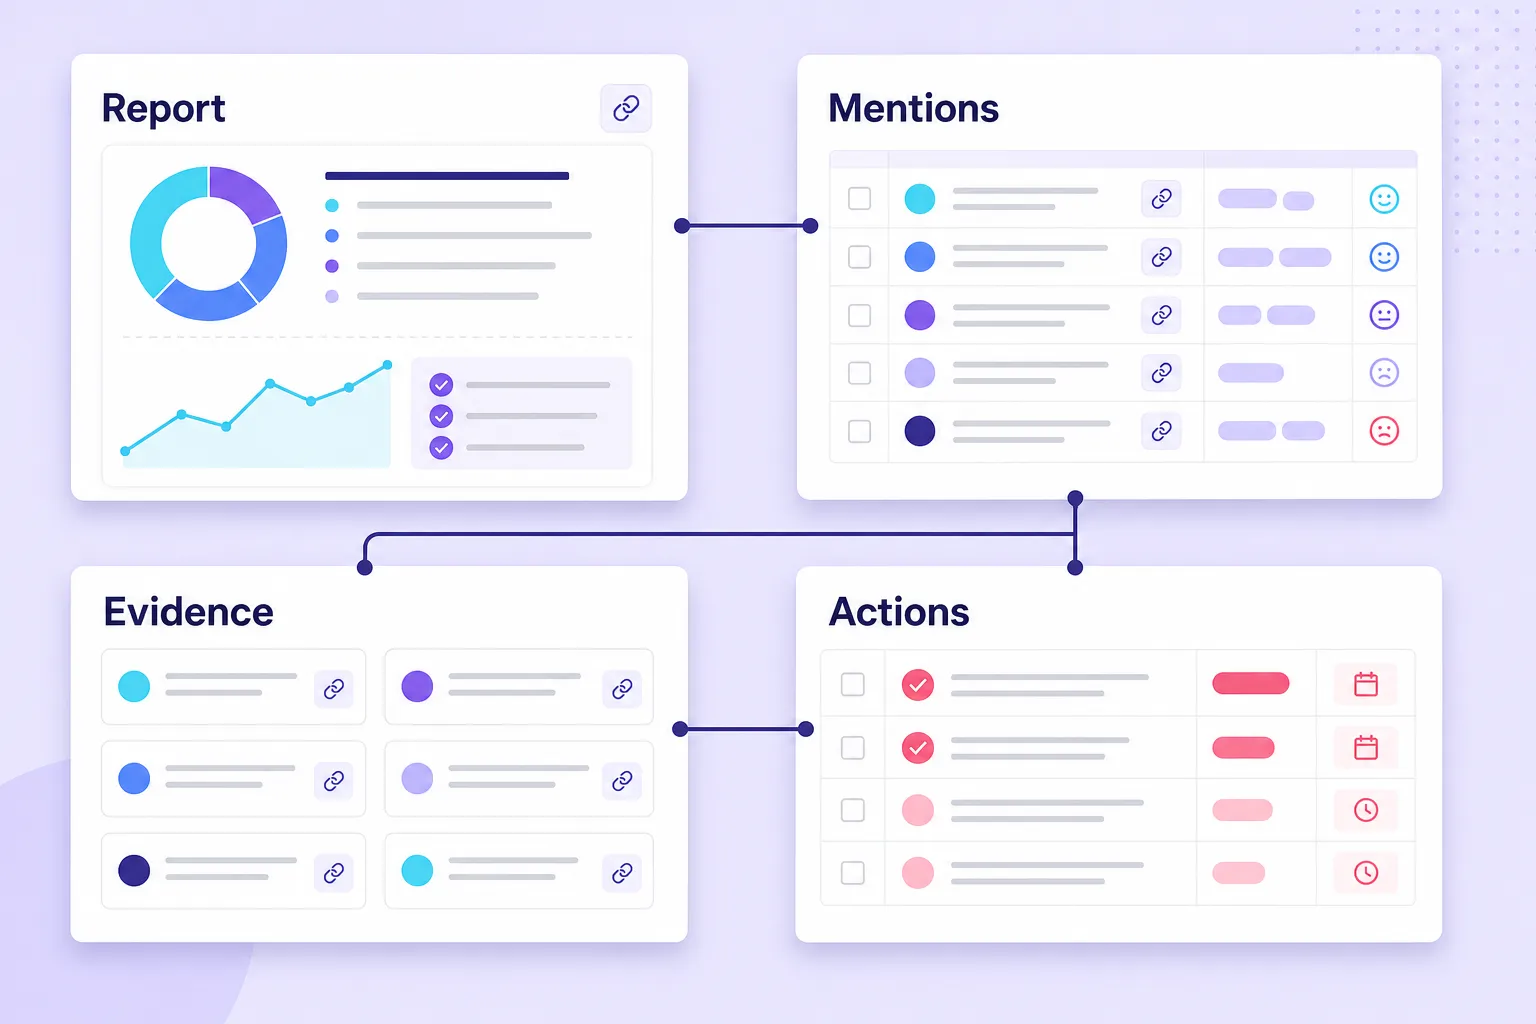
The report (Docs or Slides):
- Executive summary. Decision, short answer, what changed, main driver, risk, recommendation. One headline chart.
- Scope and method. Saved Boolean query, sources, window, comparison period, geography, exclusions, cleaning rules, sentiment method.
- Metrics dashboard. A five-to-seven metric table with current value, prior-period value, and change. Every metric name links to its glossary formula.
- Themes. One section per theme, each with its count, share, own sentiment split, and two to three linked example mentions.
- Competitor share of voice. A stacked bar, you versus your named set.
- Limitations. The five-part honesty section.
- Action register. A table of recommendations, each with owner, due date, confidence, and the metric it should move.
Make the finished deck accessible: add alt text to every chart, keep text-to-background contrast high, label axes and denominators directly on the chart, and ensure screenshots are legible when projected. An executive-friendly chart states its own denominator so nobody has to ask.
The spreadsheet companion needs these tabs: Query Log, Raw Mentions, Clean Mentions, Theme Coding, Evidence Library, Metric Dashboard, and Action Register, plus an optional AI Visibility Checks tab. Keep one row per mention with permalink, author, reach, date, platform, sentiment, and theme. Every chart in the report is a pivot of that sheet.
Full Worked Example: Rivertown Coffee Co., January 2026
Here is the whole thing end to end on a fictional brand, so you can see the analysis, not just the headings. Rivertown is a mid-size DTC roaster with four U.S. stores. The decision on the table: should Rivertown invest in a ready-to-drink (RTD) cold brew launch for summer, and what should it do about a recurring shipping complaint? All numbers are illustrative and internally consistent.
Scope
Query: ("Rivertown Coffee" OR "Rivertown roasters" OR @rivertowncoffee OR #rivertown) AND (coffee OR beans OR "cold brew" OR shipping OR subscription) NOT (job OR hiring OR "rivertown mall"). Sources: X, Instagram, TikTok, Reddit, news, blogs, forums. Window: January 1 to 31, 2026, U.S. only, English. Comparison period: December 1–31, 2025. Total pulled: 4,790. Filtered as irrelevant, duplicate, or spam: 608. Analyzed set: 4,182 mentions. All 4,182 were sentiment-classified, so channel shares, theme shares, and overall sentiment rates use 4,182 mentions. Sentiment within each theme uses that theme’s mention count—for example, shipping negativity uses 438 mentions. Share of voice uses the competitor-set total (17,452), and AI visibility uses the 60 sampled prompts.
Mentions by channel
| Channel | Mentions | Share |
|---|---|---|
| X | 1,240 | 30% |
| 1,090 | 26% | |
| 580 | 14% | |
| News and blogs | 470 | 11% |
| TikTok | 420 | 10% |
| Forums and other | 382 | 9% |
| Total | 4,182 | 100% |
Read it this way: no single platform owns the story. A report that only sampled X would miss 70% of the conversation, including the Reddit threads that carried the sharpest shipping complaints.
Metrics dashboard
| Metric | January | December | Change |
|---|---|---|---|
| Mention volume | 4,182 | 2,910 | +43.7% |
| Aggregate potential audience | 7.4M | 5.1M | +45.1% |
| Net sentiment | +17% | +34% | -17 pts |
| Share of voice (vs. 3 rivals) | 24% | 21% | +3 pts |
| Negative mention count | 878 | 470 | +86.8% |
Volume and reach are up, which looks like a win. But net sentiment fell 17 points and negative mentions nearly doubled. Rising volume driven by rising complaints is not awareness; it is exposure.
Theme breakdown
| Theme | Mentions | Share | Theme sentiment |
|---|---|---|---|
| Taste and quality praise | 612 | 15% | 91% positive |
| Shipping delays | 438 | 10% | 82% negative |
| Price vs. competitors | 322 | 8% | 54% negative |
| Sustainable packaging | 297 | 7% | 73% positive |
| RTD cold brew curiosity | 181 | 4% | 64% positive or question-form |
| Everyday mentions and shares | 2,332 | 56% | mostly neutral |
Now the story is clear. The product is loved. The damage is operational: shipping is the only large, sharply negative theme, and its velocity confirms the risk, climbing from 71 mentions in week one to 196 in week four.
Share of voice
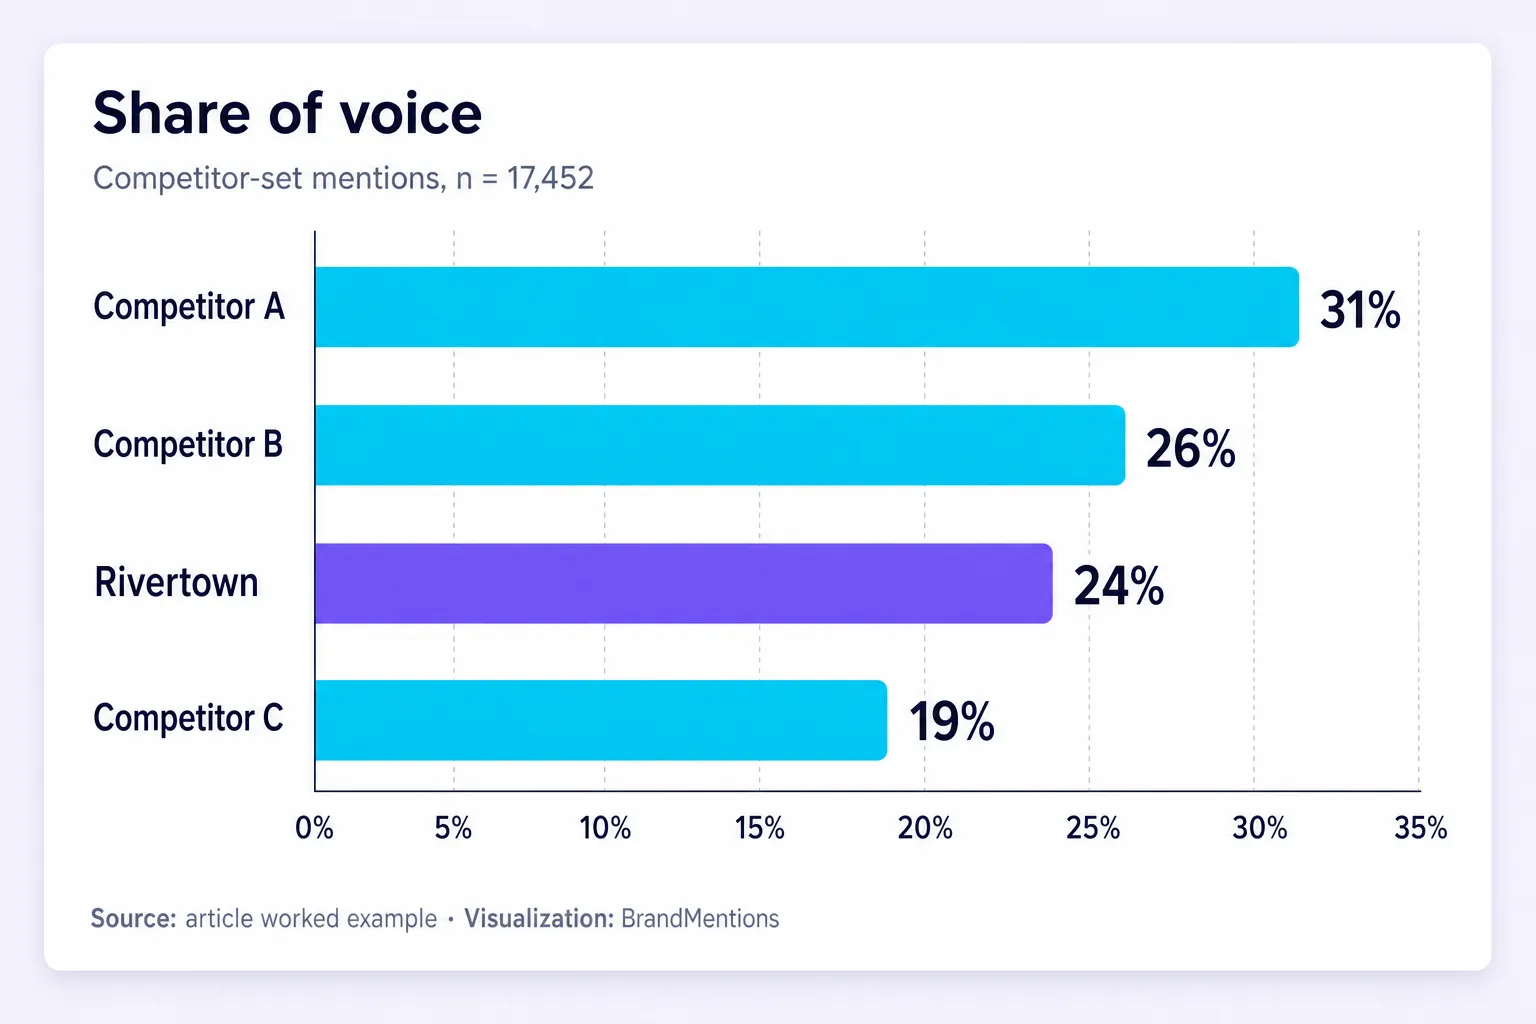
Competitor-set mentions, n = 17,452.
| Brand | Mentions | Share of voice |
|---|---|---|
| Competitor A | 5,410 | 31% |
| Competitor B | 4,540 | 26% |
| Rivertown | 4,182 | 24% |
| Competitor C | 3,320 | 19% |
Rivertown ranks third by share of voice across the specified competitor set. On Reddit, where purchase questions cluster, its share falls to 16% (580 of 3,625 competitor-set Reddit mentions).
Evidence
In a real report, include three linked examples of shipping complaints. The examples below are fictional and illustrate the required evidence format: one Reddit thread (paraphrased: a customer says the beans are great but every order this month arrived six days late), one Instagram post from a 48,000-follower account, and one review-site comment quoted by two others. Quote the high-reach account and the review verbatim, typos intact; paraphrase the private Reddit user.
Limitations
Sample: sentiment was machine-assisted, with the top 100 highest-reach mentions and all shipping-tagged mentions reviewed by hand. A second coder independently labeled a random 10% sample (418 mentions) for sentiment and theme, and agreed with the first coder on 76% of labels before reconciliation. Coverage: private groups, DMs, and deleted posts are excluded; X data was collected continuously from January 1 to 31, with no known gaps. Exclusions: non-U.S. and non-English mentions. Attribution: the sentiment drop correlates with a known carrier delay, but other factors are possible.
AI visibility
Across a fixed set of 60 answer-engine prompts about "best DTC coffee" and related terms, Rivertown appeared in 14 of 60 answers (23%) versus 22 of 60 (37%) for Competitor A. Logged monthly, same prompts, same location and device.
Executive summary (written last, placed first)
This report supports two decisions: whether Rivertown should launch an RTD cold brew this summer, and how it should respond to rising shipping complaints. January mentions rose 43.7%, but net sentiment fell 17 points. Shipping delays were a prominent negative theme in January: 438 mentions, 82% negative, climbing from 71 in week one to 196 in week four. The product is not the problem: taste and quality mentions were 91% positive, and 181 mentions showed curiosity about RTD cold brew. Recommendation: the Ops lead publishes a shipping SLA update and starts weekly delay reporting by February 14, and the Product lead runs a 500-customer RTD survey by March 15 before any launch commitment.
Action register
| Finding | Owner | Action | Due | Success metric |
|---|---|---|---|---|
| Shipping churn risk | Ops lead | Publish SLA update, start weekly delay report | Feb 14 | Delay mentions down 50% in 60 days |
| RTD demand signal | Product lead | 500-customer survey, one-store test | Mar 15 | 300 responses, 30% purchase intent |
| Reddit gap | Community manager | 2 hours/week on coffee subreddits | Ongoing | 20 answered threads/month |
| AI visibility gap | Content lead | Publish quotable spec pages (price, roast, shipping, sustainability) | Mar 1 | Re-sample: 20+ of 60 prompts cite Rivertown |
This illustrative report proposes a shipping review and further demand research. It does not demonstrate an implemented decision or measured outcome.
Metric Glossary: Formulas and Denominators
This is the box that separates a report people trust from one they quietly discount.
| Metric | Formula | Denominator / note |
|---|---|---|
| Mention volume | Count of relevant mentions in window | After filtering; compare only across identical date ranges |
| Share of voice | Your mentions ÷ (your mentions + named competitor set) | State the competitor set and window |
| Net sentiment | (Positive − Negative) ÷ classified mentions | Neutral sits in the denominator, not the numerator |
| Positive sentiment % | Positive ÷ classified mentions | Not ÷ total pulled |
| Aggregate potential audience | Sum of mentioning accounts' follower counts | De-duplicate repeat authors; it is potential, not verified views |
| Engagement rate | Platform-specific (e.g., Instagram: [(likes + comments + saves + shares) ÷ followers] × 100) | Never blend platforms; state the denominator per platform |
| Theme share | Theme mentions ÷ classified mentions | Must sum sensibly; declare if themes overlap |
| Theme mention growth | (This week's theme mentions − last week's) ÷ last week's | Flags themes about to spread |
| Brand appearance rate | Brand citations ÷ sampled prompts | Fix the prompt list and sample size or the number is meaningless |
One rule keeps you honest: use the appropriate denominator for each metric, label it explicitly, and keep its definition consistent across comparisons.
Reach vs. impressions: reach counts unique accounts that could have seen content; impressions count total displays including repeats. One person seeing a post three times is reach of 1 and impressions of 3. Listening tools report potential reach, which is an audience estimate, not a view count.
Share of voice vs. share of conversation: share of voice counts mentions of a named brand; share of conversation counts the broader category, including threads where no brand is named. Track both when you want brand awareness separated from category awareness, which lines up with how you are measuring brand awareness elsewhere. The Emplifi engagement documentation is a useful reminder that even "engagement rate" has no single formula across platforms.
The Decision-Grade Scorecard
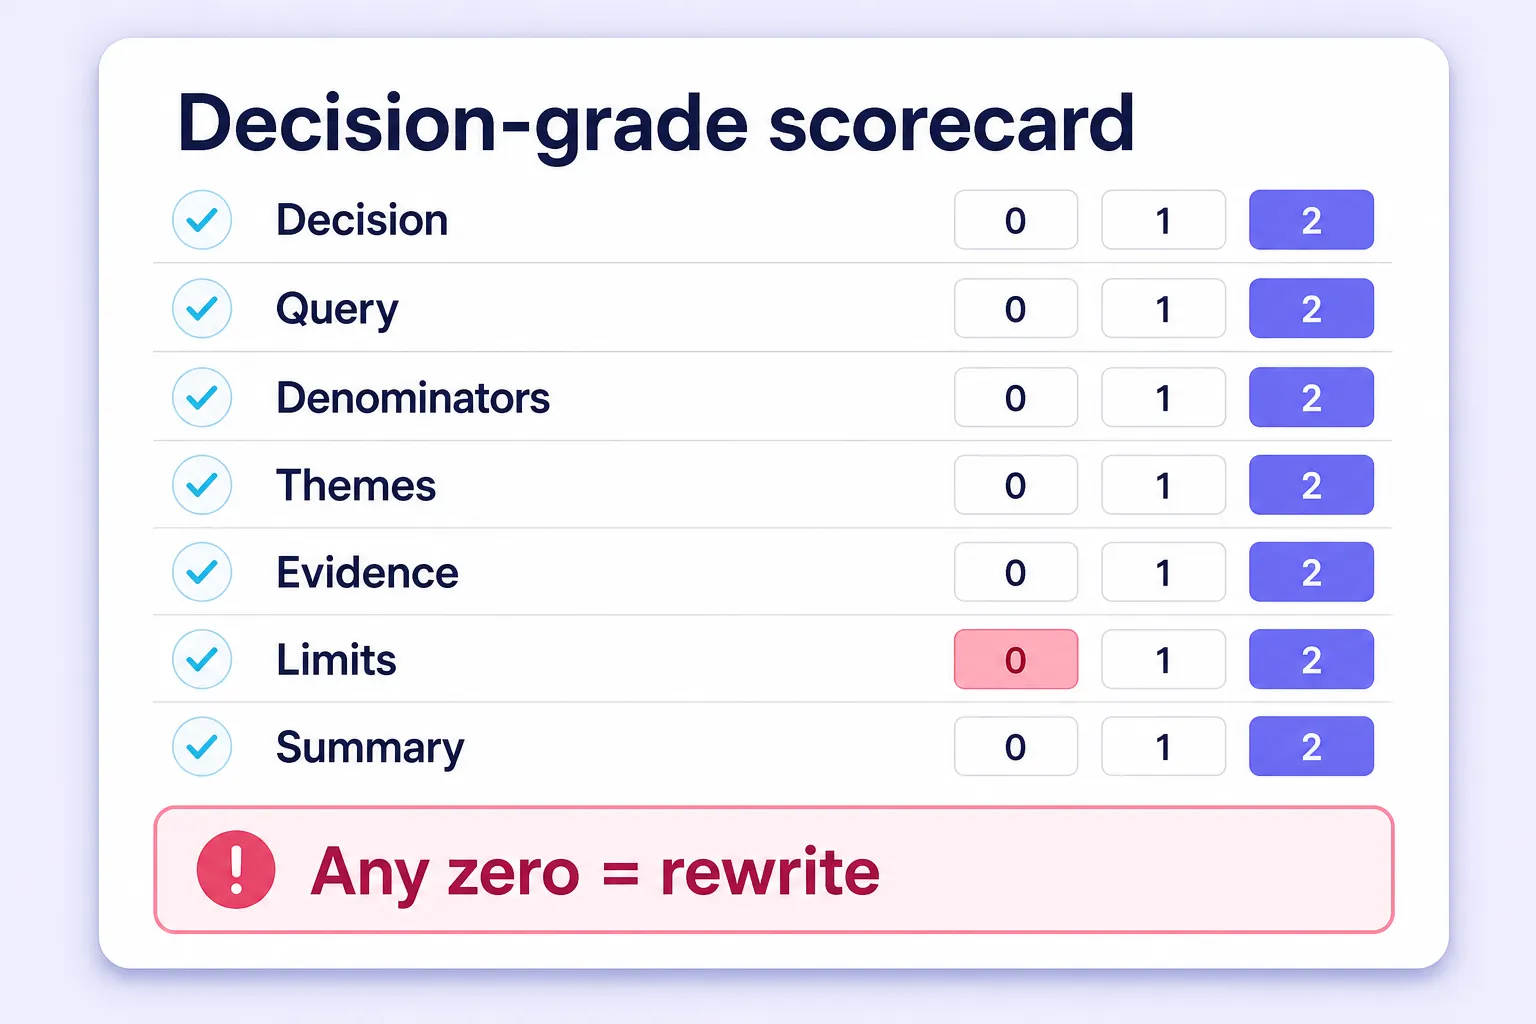
Before you send a report, score it. Rate your draft 0, 1, or 2 on each of seven signals.
| Signal | 0 points | 1 point | 2 points |
|---|---|---|---|
| Named decision | None stated | Vague goal | Specific decision, owner, deadline |
| Query transparency | No query shown | Query described | Exact Boolean string saved |
| Denominators | None stated | Some stated | Every rate has a denominator |
| Theme depth | Numbers only | Themes listed | Themes with per-theme sentiment and velocity |
| Evidence links | None | Screenshots only | Clickable permalinks under each claim |
| Limitations | None | One line | Sample, coverage, method, attribution, exclusions |
| Summary quality | Status update | Findings only | Finding + meaning + recommendation |
Scoring bands: 11 to 14 is decision-grade, ship it. 8 to 10 needs one rewrite pass on the weak sections. Below 8 is a dashboard, not a report.
The zero rule: any single zero disqualifies the report regardless of total, because a brilliant analysis with no stated decision is still a well-dressed dashboard. Run this on your last three reports. Most teams discover they consistently lose points on denominators, limitations, and the named decision, which are the three cheapest things to fix.
Common Mistakes
Leading with reach. It is potential audience, not behavior, and the easiest number to inflate. Lead with volume and sentiment.
Reporting sentiment on thin data. Below about 50 mentions, a percentage on its own misleads. Show the raw counts next to it.
One sentiment number for the whole brand. The average hides the theme that is on fire. Break sentiment down by theme every time.
Mixing denominators. A blended engagement rate across Facebook, Instagram, and YouTube is statistically meaningless. Separate the charts.
Writing the summary first. You cannot summarize a conclusion you have not reached. It shows.
The watermelon report. Green summary metrics on the outside, severe negative issues hidden underneath. Your job is to protect the brand, not the brand manager's ego.
Themes without verbatims, and recommendations without owners. A theme with no quote is an assertion. A recommendation with no owner is a wish.
The 6-Point Pre-Send Checklist
Verify before you hit send:
- Does the first page name the decision, with an owner and a deadline?
- Is the Boolean query, date range, and exclusion list written down?
- Does every rate metric state its denominator?
- Are themes decision categories, each with a count, sentiment, and at least one linked mention?
- Are limitations stated in plain language, including what you could not access?
- Does every finding in the action register have an owner, a date, and a success metric?
Frequently Asked Questions
How to Create a Social Listening Report in 2026?
Follow the seven-part anatomy (decision, scope, metrics, themes, evidence, limitations, action register). Define the decision first, then collect, measure, cluster, verify, and document limitations, and write the executive summary last. The illustrative Rivertown Coffee example above shows the method in action: a 43.7% volume rise with net sentiment down 17 points, traced to one 82%-negative shipping theme, leading to a recommended shipping review and RTD customer research.
How often should I send a social listening report?
Match cadence to the decision, not the calendar. Reputation and crisis decisions need daily or hourly snapshots, campaigns suit weekly, and positioning or category reviews suit monthly or quarterly deep-dives. Running everything weekly usually means reporting on a rhythm that fits nobody's real decision.
How long should a social listening report be?
As short as the decision allows. A weekly executive brief is one page with one chart and one recommendation. A quarterly deep-dive runs five to ten pages plus a spreadsheet of raw mentions. Anything longer is usually a data dump wearing a report costume.
What tools do I need to build one?
A collection tool that keeps source links, a spreadsheet, and a presentation format. Tools like BrandMentions, Brand24, Meltwater, Sprout Social, Hootsuite, and Mentionlytics all collect cross-web mentions; choose on source coverage, sentiment transparency, and whether evidence links survive export. At zero budget, 100 to 200 hand-pulled mentions coded in a spreadsheet still produce a credible report if you state the sample size.
Conclusion: Turn Social Listening into Clear Decisions
A useful social listening report explains what changed, why it matters, and what to do next. Start with a defined business question, use consistent metrics, support your findings with linked evidence, and make the limits of your data clear. Give each recommended action an owner, a deadline, and a measurable outcome.
Clear structure also makes your findings easier to understand and summarize. If you publish the report, keep its key conclusions self-contained and connect them to accessible sources. This helps readers assess the evidence and gives search and AI systems clearer context, without guaranteeing rankings or citations.
Start with your latest report. Use the scorecard to identify its weakest section, revise it, and check that the executive summary supports a specific decision. At the next review, record what action was taken and whether the intended outcome followed. That turns social listening from a reporting routine into a process for learning and improving.
Filed under: Social Media Marketing